SOCIO-ECONOMIC DISADVANTAGE
The index of relative socio-economic disadvantage is one of five Socio-economic Indexes for Areas (SEIFA) compiled by the ABS following each population census. This index includes attributes such as low income, low educational attainment, high unemployment and jobs in relatively unskilled occupations. The index is based on the characteristics of all persons in a defined area (the Census Collector's District from the 2006 Census of Population and Housing) and not the socio-economic situation of a particular individual. The lower the value of this index, the greater is the level of disadvantage experienced by residents of the area.
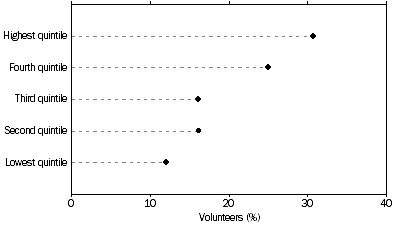
4.7 SPORT AND PHYSICAL RECREATION VOLUNTEERS, By socio-economic disadvantage

There appears to be an association between the incidence of volunteering and the level of disadvantage in that the rate of volunteering increased as the quintiles increased, from 28% for those in the lowest quintile to 43% for those in the highest quintile. For sport and physical recreation organisation volunteers the rate rose from 9% for the lowest quintile to 18% for the highest, and for volunteers for other organisations only, the rate increased from 19% for the lowest quintile to 25% for the highest. This pattern suggests that in general, the higher the level of socio-economic disadvantage, the less likely persons are to be volunteers, whether this be for sport and physical recreation organisations or for other organisations.
4.8 Sport and Physical Recreation and Other Volunteers, By socio-economic disadvantage |
|
 |  | Sport & physical recreation organisation(s) only | Sport & physical recreation and other organisation(s) | Total sport & physical recreation organisation(s) | Other organisation(s) only | Total volunteers | Not a volunteer | Total persons aged 18 years & over |
|
| Volunteers ('000) |  |  |  |  |  |  |  |
 | Lowest quintile | 116.6 | 154.7 | 271.3 | 560.1 | 831.4 | 2 177.4 | 3 008.8 |
 | Second quintile | 162.7 | 204.2 | 366.9 | 751.3 | 1 118.1 | 2 063.2 | 3 181.3 |
 | Third quintile(a) | 154.5 | 211.1 | 365.6 | 779.8 | 1 145.4 | 2 220.3 | 3 365.7 |
 | Fourth quintile | 284.4 | 283.6 | 568.0 | 783.5 | 1 351.5 | 2 083.0 | 3 434.5 |
 | Highest quintile | 335.9 | 360.0 | 695.9 | 941.9 | 1 637.8 | 2 160.0 | 3 797.8 |
 | Total | 1 054.2 | 1 213.6 | 2 267.7 | 3 816.5 | 6 084.2 | 10 703.9 | 16 788.2 |
| Volunteer rate (%) |  |  |  |  |  |  |  |
 | Lowest quintile | 3.9 | 5.1 | 9.0 | 18.6 | 27.6 | 72.4 | 100.0 |
 | Second quintile | 5.1 | 6.4 | 11.5 | 23.6 | 35.1 | 64.9 | 100.0 |
 | Third quintile(a) | 4.6 | 6.3 | 10.9 | 23.2 | 34.0 | 66.0 | 100.0 |
 | Fourth quintile | 8.3 | 8.3 | 16.5 | 22.8 | 39.4 | 60.6 | 100.0 |
 | Highest quintile | 8.8 | 9.5 | 18.3 | 24.8 | 43.1 | 56.9 | 100.0 |
 | Total | 6.3 | 7.2 | 13.5 | 22.7 | 36.2 | 63.8 | 100.0 |
|
| (a) Includes responses not available. |
 Print Page
 Print All