CENSUS OF POPULATION AND HOUSING
The Census collects detailed information about people employed in sport and physical recreation occupations and industries. However, the employment information relates to the main job in the week before Census and does not include second jobs, unpaid work, or people usually working in a sports and physical recreation occupation but 'between jobs' during the week before Census night. Some people employed in sport and physical recreation occupations will not have been recorded as such during the Census period because some types of sport and physical recreation work are seasonal in nature (e.g. cricket umpiring).
Employment in sport and physical recreation occupations
Of all people employed in the week prior to the 2011 Census, 1% had their main job in a sport and physical recreation occupation, the same proportion as in the 2006 Census. While the increase in employment in sport and physical recreation occupations between 2006 and 2011 was 21%, compared with an 11% increase for all occupations over the same period, in absolute terms this represented an increase from 79,156 persons in 2006 to 95,590 persons in 2011.
The sport and physical recreation occupations recording the largest numbers of people employed in 2011 were fitness instructors (21,514), greenkeepers (11,346), swimming coach or instructors (10,279), other sports coach or instructors (4,985) and stablehands (4,321).
There were only a few sport and physical recreation occupation groups that experienced a decline in numbers between 2006 and 2011. In percentage terms, the number of boat builders and repairers fell 33% and canvas goods fabricators fell 22%.
Of the 95,590 people employed in sport and physical recreation occupations, there were more men (58%) than women (42%). In comparison, of all employed people, 53% were male and 47% were female. Of people employed as footballers and boat builders and repairers, 98% were male. In contrast, the majority of horse riding and gymnastic coachers or instructors (85% and 81% respectively) were female.
People employed in sport and physical recreation occupations had a younger age profile relative to all employed people. The 20-24 year age group had the largest number of people employed in sport and physical recreation occupations (18%). There were also considerably more younger workers (aged 15-24 years) employed in occupations such as sports umpires (92%), lifeguards (73%) and footballers (67%). By contrast, almost half (49%) of those employed as horse breeders were aged 50 years or over.
8.1 Employment in sport and physical recreation occupations(a), By sex - 2006 and 2011 |
|
 | 2006 CENSUS | 2011 CENSUS |
| Occupations | Males | Females | Persons | Males | Females | Persons |
|
| Boat Builder and Repairer | 3 934 | 63 | 3 997 | 2 646 | 44 | 2 690 |
| Bungy Jump Master | 10 | - | 10 | 3 | - | 3 |
| Canvas Goods Fabricator | 419 | 316 | 735 | 320 | 251 | 571 |
| Diving Instructor (Open Water) | 394 | 148 | 542 | 401 | 165 | 566 |
| Dog Handler or Trainer | 326 | 249 | 575 | 430 | 409 | 839 |
| Dog or Horse Racing Official | 459 | 81 | 540 | 426 | 106 | 532 |
| Fishing Guide | 93 | 3 | 96 | 99 | 9 | 108 |
| Fitness Centre Manager | 749 | 914 | 1 663 | 1 174 | 1 344 | 2 518 |
| Fitness Instructor | 5 076 | 8 724 | 13 800 | 8 778 | 12 736 | 21 514 |
| Footballer | 1 440 | 13 | 1 453 | 1 584 | 25 | 1 609 |
| Golfer | 1 162 | 55 | 1 217 | 1 032 | 58 | 1 090 |
| Greenkeeper | 11 815 | 321 | 12 136 | 11 027 | 319 | 11 346 |
| Gunsmith | 172 | 6 | 178 | 199 | 4 | 203 |
| Gymnastics Coach or Instructor | 410 | 1 634 | 2 044 | 487 | 2 020 | 2 507 |
| Horse Breeder | 766 | 651 | 1 417 | 748 | 646 | 1 394 |
| Horse Riding Coach or Instructor | 77 | 528 | 605 | 105 | 592 | 697 |
| Horse Trainer | 1 967 | 797 | 2 764 | 2 072 | 1 034 | 3 106 |
| Hunting Guide | - | - | - | 4 | - | 4 |
| Jockey | 501 | 148 | 649 | 424 | 162 | 586 |
| Lifeguard | 1 687 | 907 | 2 594 | 2 271 | 1 271 | 3 542 |
| Mountain or Glacier Guide | 14 | 5 | 19 | 12 | 4 | 16 |
| Other Sports Coach or Instructor | 2 529 | 932 | 3 461 | 3 508 | 1 477 | 4 985 |
| Other Sports Official | 95 | 23 | 118 | 116 | 31 | 147 |
| Outdoor Adventure Guides, nec(b) | 149 | 61 | 210 | 225 | 121 | 346 |
| Outdoor Adventure Instructor | 519 | 313 | 832 | 847 | 536 | 1 383 |
| Recreation Officer | 773 | 1 288 | 2 061 | 741 | 1 098 | 1 839 |
| Sail Maker | 428 | 43 | 471 | 364 | 34 | 398 |
| Snowsport Instructor | 392 | 186 | 578 | 351 | 201 | 552 |
| Sports Administrator | 1 185 | 721 | 1 906 | 1 417 | 849 | 2 266 |
| Sports and Personal Service Workers, nfd(c) | 1 613 | 2 267 | 3 880 | 1 228 | 952 | 2 180 |
| Sports Centre Manager | 2 071 | 1 336 | 3 407 | 2 094 | 1 487 | 3 581 |
| Sports Development Officer | 559 | 339 | 898 | 719 | 354 | 1 073 |
| Sports Umpire | 1 804 | 579 | 2 383 | 2 490 | 803 | 3 293 |
| Sportspersons, nec(d) | 710 | 133 | 843 | 880 | 151 | 1 031 |
| Stablehand | 760 | 544 | 1 304 | 1 702 | 2 619 | 4 321 |
| Swimming Coach or Instructor | 1 607 | 5 977 | 7 584 | 2 434 | 7 845 | 10 279 |
| Tennis Coach | 1 677 | 468 | 2 145 | 1 946 | 479 | 2 425 |
| Trekking Guide | 6 | 4 | 10 | 16 | 8 | 24 |
| Whitewater Rafting Guide | 28 | 3 | 31 | 26 | - | 26 |
| Total sport and physical recreation occupations(e) | 48 376 | 30 780 | 79 156 | 55 346 | 40 244 | 95 590 |
| Total employment | 4 911 132 | 4 193 055 | 9 104 187 | 5 366 665 | 4 691 660 | 10 058 325 |
|
| - nil or rounded to zero (including null cells) |
| (a) ANZSCO was used for the collection of ABS occupation data. |
| (b) Includes Outdoor adventure guides nec and Outdoor adventure guides nfd. |
| (c) Includes Sports and personal services workers nfd, Sports and fitness workers nfd and Sports Coaches, Instructors and Officials nfd. |
| (d) Includes Sportspersons nec and Sportspersons nfd. |
| (e) Small cells or census data are randomly adjusted to protect confidentiality. There may be minor discrepancies between column and row total in tables containing similar data. |
| Source: Employment in Sport and Recreation, Australia, August 2011 (cat. no. 4148.0). |
Earnings and hours worked
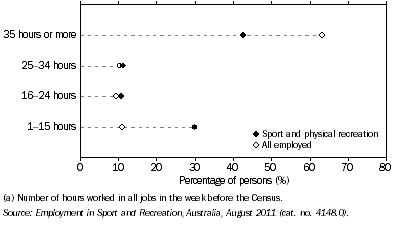
The 2011 Census found that, compared with people employed in all occupations, people employed in sport and physical recreation occupations were more likely to be working part-time (i.e. less than 35 hours per week). Nearly two thirds (63%) of people employed in all occupations worked full-time (i.e. 35 hours and over). In comparison, only 43% of people employed in sport and physical recreation occupations worked full-time. Relatively large percentages of people employed as sports umpires (91%), swimming (86%) and gymnastics coaches (83%) worked part-time.
8.2 Weekly hours worked profile of occupations(a) - August 2011

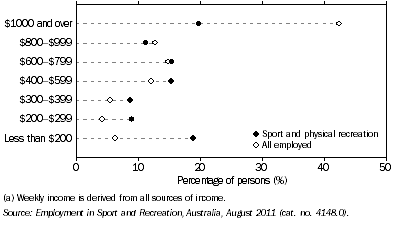
There was a higher percentage of people employed in all occupations (42%) with a weekly income of $1,000 or more compared with people employed in sport and physical recreation occupations (20%). This difference was also seen in 2006 with 12% of people employed in sport and physical recreation occupations earning $1,000 or more compared with 30% of all employed people. This lower income may be related to the higher incidence of part-time employment in sport and physical recreation occupations. Almost half (49%) of all people employed in sport and physical recreation occupations received a gross weekly income between $200 and $799.
8.3 Weekly income profile of occupations(a) - August 2011

 Print Page
 Print All