Australian Health Survey: Physical Activity

Latest release

Physical activity results from the 2011-13 Australian Health Survey, presented with selected population characteristics and health risk factors

Reference period
2011-12 financial year
Released
19/07/2013
Next release Unknown
First release

Key findings

Physical activity has been identified as an important contributor to maintaining good overall health. The amount of time spent on physical activity has long been a focus for research and policy makers. Low levels of activity are identified as a risk factor for a range of health conditions, including cardiovascular disease, diabetes and osteoporosis, as well as being a strong contributor to levels of obesity.

In recent times, the dangers of high levels of sedentary behaviour to overall health have also been recognised in relation to chronic disease and obesity.

Children and young people

  • In 2011-12, toddlers and pre-schoolers (aged 2–4 years) spent an average of around 6 hours per day engaged in physical activity. They also spent almost one and a half hours (83 minutes) in the sedentary activities of watching TV, DVDs or playing electronic games.
  • On average, children and young people aged 5–17 years spent one and a half hours (91 minutes) per day on physical activity and over two hours a day (136 minutes) in screen-based activity with physical activity decreasing and screen-based activity increasing as age increased.
  • Just under half (44%) of all children and young people (2–17 years) had at least one type of screen-based item (e.g. TV, computer, or game console) in their bedroom. For the 15–17 year olds, three-quarters had some kind of screen-based media in their bedroom and this was associated with them spending an extra two hours per week watching/playing screen-based media compared with those who did not have any such item in their bedroom.
  • The children and young people who participated in the pedometer study, recorded an average of 9,140 steps per day. Children aged 5–8 and 9–11 years were most likely to reach 12,000 steps per day (22% and 24% respectively), while 15–17 year olds were least likely to (7%).
     

Adults

  • In 2011-12, adults spent an average of just over 30 minutes per day doing physical activity. However, against the National Physical Activity Guidelines for adults "to do at least 30 minutes of moderate intensity physical activity on most days", only 43% of adults actually met the "sufficiently active" threshold.
  • The highest levels of physical activity were among the young adults with 53% of 18–24 year olds being classed as sufficiently active. Levels of physical activity tended to decline in older ages, with the lowest being among people aged 75 years and over, where the average time spent in physical activity was 20 minutes per day, and just one in four this age were classified as sufficiently active against the guidelines.
  • Levels of sufficient physical activity were associated with a range of factors:
     
    • Relative socioeconomic disadvantage: Adults in the least disadvantaged quintile were 1.5 times more likely to have done sufficient physical activity compared with those in the most disadvantaged quintile.
    • Health status: Adults who described their health as "excellent" were over twice as likely to have done sufficient physical activity compared with people with "poor" self-assessed health.
    • Body mass index (BMI): The underweight/normal weight population were 1.4 times more likely to have done sufficient physical activity compared with the obese population.
    • Smoking status: ex–smokers and people who never smoked were 1.2 times more likely to have done sufficient physical activity compared with current smokers.
       
  • Sedentary activity occupied an average 39 hours per week for adults, with close to 10 hours of this sitting at work. People employed in more sedentary occupations such as clerical and administrative workers spent on average 22 hours a week sitting for work.
  • Watching TV was the most prevalent sedentary activity, at nearly 13 hours a week, peaking at over 19 hours per week on average for people aged 75 and over. Using the computer or Internet (for non-work purposes) peaked at almost 9 hours per week for 18–24 year olds.
  • The adults who participated in the pedometer study, recorded an average of 7,400 steps per day. Less than one in five adults (19%) recorded 10,000 steps per day on average.


For definitions used in this publication, see Glossary.
Children and young people

Physical activity is an important contributor to good health for children and young people. The amount of time spent on physical activity has long been a focus for research and policy makers. A complimentary research focus is sedentary time, and in particular, the amount of time spent on screen-based activities, which are considered strong contributors to sedentary behaviour. In recognition of this, National Physical Activity Guidelines have been developed for all Australians including children and young people. 

Physical activity and screen-based recommendations for children

Children aged 2-4 years

For healthy development, learning and enjoyment, it is important for toddlers and pre-schoolers to be physically active each day. Active play is the best type of physical activity, involving both indoor and particularly outdoor play.

Data source and definitions

In 2011-12, 2–4 year olds spent an average 6 hours and 12 minutes per day engaged in physical activity with just under half (47%) of the physical activity coming from outside activities. The 2–4 year olds in Queensland and Northern Territory spent significantly longer (3 hours and 27 minutes and 4 hours respectively) in outside physical activity per day compared to the national average of almost 3 hours.

Most 2–4 year olds (84%) averaged 3 or more hours of physical activity per day. However, just under three-quarters (72%) of 2–4 year olds were physically active for 3 hours or more per day on all 7 days prior to interview, meeting the physical activity recommendation.

  1. Average over 7 days prior to interview
  2. Proportions do not add to 100%, as includes children with time not known
  3. Category 0-1 includes 1 minute to 59 minutes, 1-2 includes 1 hour to 1 hour and 59 minutes, etc.

At the same time, 2–4 year olds spent almost one and a half hours (83 minutes) per day in the sedentary activities of watching TV/DVDs or playing electronic games. While 43% averaged no more than 60 minutes a day over the reporting week, only one in four (26%) met the screen-based activity recommendation on all 7 days prior to interview.

  1. Average over 7 days prior to interview
  2. Proportions do not add to 100%, as includes children with time not known
  3. Category 0-1 includes 1 minute to 1 hour, 1-2 includes 61 minutes to 2 hours, etc.

Almost one in six (16%) of 2–4 year olds had at least one item of screen–based equipment in their bedroom, such as a TV, computer or game console. These children spent on average an extra 22 minutes per day engaged in screen-based activities, and were twice as likely as those without screen equipment in their bedrooms to have done more than the recommended 60 minutes per day. See Tables 3,17 and 22 in the Data downloads section for more information.

5-17 year olds

Establishing a foundation of good active habits early in life can lead to ongoing healthy behaviours. Regular physical activity is recognised as playing a key role in reducing the risk of obesity, Type 2 diabetes, cardiovascular disease, as well as building a strong musculoskeletal system. In addition, physical activity may improve mental health and psycho-social wellbeing. Among children and adolescents, regular physical activity has been associated with improved school performance, a greater sense of personal responsibility and group participation. [1]

Data source and definitions

In 2011-12, children aged 5–17 years did an average of one and a half hours (91 minutes) of physical activity per day, with just over 60% averaging at least one hour per day. This contrasts with around one in five (19%) doing the recommended 60 minutes per day across all seven days prior to interview and almost half (48%) met the recommendation on at least five out of seven days.

  1. Average over 7 days prior to interview
  2. Proportions do not add to 100%, as includes children with time not known
  3. Category 0-1 includes 1 minute to 59 minutes, 1-2 includes 1 hour to 1 hour and 59 minutes, etc.

The average amount of time spent in sedentary screen–based activities for 5–17 year olds was over two and a quarter hours (136 minutes) per day, with just 6 minutes of this being for homework. Fewer than one in three in this age group (29%) met the "no more than 120 minutes of screen–based entertainment" per day threshold on all previous seven days, but 59% met the recommendation on at least five out of seven days. See Table 2: Summary activity indicators by age then sex, Children aged 5–17 years and Table 16: Number of days met physical and screen-based activity recommendations by sex and age, Children aged 2–17 years.

  1. Average over 7 days prior to interview
  2. Proportions do not add to 100%, as includes children with time not known
  3. Category 0-1 includes 1 minute to 1 hour, 1-2 includes 1 hour and 1 minute to 2 hours, etc.

In general, physical activity decreased and screen-based activity increased as age increased. For example, while children aged 5–8 years did an average 2 hours of physical activity per day, the 15–17 year olds did half that amount (1 hour). Conversely, 15–17 year olds spent an average three hours per day engaged in screen-based leisure activity, compared to 98 minutes for the 5–8 year olds. See Tables 19: Average time spent on physical activity, Children aged 5-17 years: and Table 20: Average time spent on sedentary screen-based activity, Children aged 5–17 years.

  1. Average over 7 days prior to interview.

In addition to the level of physical activity changing with age, so did the contribution of the types of activities. In younger age groups, the overwhelming majority of physical activity was moderate to vigorous. By age 15–17 years, as overall physical activity has declined, active transport such as walking and bike riding formed a more significant portion of young people's overall physical activity (39% for 15–17 year olds). See Table 2: Summary activity indicators by age then sex, Children aged 5–17 years.

While boys and girls in younger ages had similar levels of daily physical activity, by age 12–14 years females averaged 21 minutes less than males with virtually all of that difference coming from girls' reduction in moderate to vigorous activity. At 15–17 years, the gap was 17 minutes (in favour of males) with both sexes this age doing considerably less moderate to vigorous physical activity than the 12–14 years age group.

  1. Average over 7 days prior to interview.
  1. Average over 7 days prior to interview.

Overall, TV/DVD watching was the activity which occupied the most time of all screen–based sedentary activities, taking almost one and a half hours per day (84 minutes). While still accounting for the largest share of all screen-based activities at 15–17 years of age, the relative contribution of TV/DVD watching diminished as the time spent using a computer and playing electronic games increased. Females aged 15–17 years spent an extra 7 minutes on a computer than males that age (80 and 73 minutes respectively), but 15–17 year old males spent the longest total time in sedentary activities (3 hours, 15 minutes), due to the average 45 minutes spent per day playing computer games, compared with 5 minutes among the females that age.

Half of all 5–17 year olds (51%) had some kind of screen–based equipment in their bedrooms, with TVs (28%), computers (26%) and video game consoles (25%) all relatively common. The presence of screen-based equipment in bedrooms increased with age, with three–quarters (74%) of 15–17 year olds having a screen in their bedroom compared to 28% of 5–8 year olds.

Those children and young people who had at least one of these devices in their bedroom spent significantly more time in screen–based activities than those who did not have any screen–based equipment in their bedroom. For example, 15–17 year olds who had a screen-based item in their bedroom spent an extra two hours per week watching/playing screen–based entertainment compared with those who did not have any such item in their bedroom (22 compared to 20 hours per week).

  1. Average over 7 days prior to interview.
  1. Average over 7 days prior to interview.

Adults

The importance of regular physical activity to the health and wellbeing of adults is well established and include reductions in risk of cardiovascular disease, Type 2 diabetes, certain forms of cancer, depression and some injuries. In addition, physical activity is an important element for achieving and maintaining a health body mass which is of particular focus given the increasing rates of overweight and obesity and role of this risk factor in chronic disease.

Data source

In 2011-12, adults spent an average of 33 minutes per day doing physical activity, yet the distribution was highly skewed with 60% of adults doing less than 30 minutes, and fewer than 20% doing an hour or more per day on average. In contrast, sedentary leisure occupied just over 4 hours a day on average, with almost 30% of the adult population reporting more than 5 hours of sedentary leisure activity each day.

  1. Average over last week
  2. Category 0-0.5 includes 1 minute to 29 minutes, 0.5-1 includes 30 minutes to 59 minutes, etc.
  1. Average over last week
  2. Category 0-1 includes 1 minute to 1 hour, 1-2 includes 1 hour and 1 minute to 2 hours, etc.

Physical activity

Recommendations and definitions

In 2011-12, 43% of adults met the "sufficiently active" threshold. The remainder were classed as insufficiently active (36%) or inactive (20%).

The highest levels of physical activity were among the 18–24 year olds with 59% of males and 48% of females classed as sufficiently active. Across all 18–24 year olds, this corresponded to average daily activity durations of 46 minutes for males and 32 minutes for females. Levels of physical activity tended to decline in older ages, with just one in three men and one in five women 75 years or over getting sufficient physical activity.

  1. At least 150 minutes of physical activity per week from at least five sessions.

One major factor associated with sufficient physical activity is the person's level of general health. In 2011-12, 57% of adults who described their health as "excellent" had done sufficient physical activity compared with 27% of people with "fair" and 26% with "poor" self–assessed health. In addition to doing more physical activity, people with "excellent" self-assessed health spent over five hours per week less doing sedentary leisure activity than those in "fair/poor" health. The association between self–assessed health and sufficient physical activity still remained marked even after accounting for the age pattern across the self-assessed health categories.

People living in areas of greatest disadvantage were less likely to be sufficiently active (34%) compared with those living in areas of least disadvantage (52%). The amount of physical activity per day was significantly lower (26 minutes compared with 38 minutes). Similar patterns are also seen when comparing equivalised household income and highest educational attainment with sufficient physical activity level. See Table 5: Average time spent on physical activity and sedentary behaviour, Persons aged 18 years and over for more information.

  1. At least 150 minutes of physical activity per week from at least five sessions.
  2. Based on the 2011 Index of Relative Socio-Economic Disadvantage. A lower Index of Disadvantage quintile (e.g. the first quintile) indicates an area with relatively greater disadvantage and a lack of advantage in general. A higher Index of Disadvantage (e.g. the fifth quintile) indicates an area with a relative lack of disadvantage and greater advantage in general. See Index of Relative Socio-Economic Disadvantage in the Glossary.

Not surprisingly, the intensity and type of physical activity undertaken changed across the age spectrum. Vigorous physical activity (defined as causing a large increase in heart rate or breathing) was highest among the younger adults with 18–24 year olds reporting just under 2 hours (114 minutes) on average in the last week. The average time spent in vigorous physical activity generally declined with age, with the exception of the 35–44 and 45–54 year olds averaging around 59-60 minutes. By age 75 years and over, the average time was 7 minutes, reflecting the small proportion (5%) in that age group who reported doing any vigorous physical activity. See Table 8: Type of physical activity, Persons aged 18 years and over (minutes).

Time spent walking for fitness, recreation or sport peaked among people aged between 45–74 years with around 75-80 minutes per week. This was around twice the time spent by people aged 18–24 years (40 minutes). The increased time spent walking for fitness from middle age years onwards is in part a consequence of greater male participation in walking which rose from 27% at age 18–24 year to peak at 43% by age 55–64 years.

Sedentary behaviour

The relationship between sedentary behaviour and health outcomes has become of increasing interest to researchers and policy makers.

Definitions

Overall, sedentary activity occupied, on average, 39 hours per week for adults, of which about 10 hours was at work and 29 hours was in leisure (including transport).

Watching TV was the most prevalent leisure time sedentary activity, taking up an average of nearly 13 hours per week. Older people tended to watch the most TV, with the 75 years and over group watching over 19 hours per week on average. In contrast, using computers or phones was more concentrated in younger ages with these technologies occupying 11 hours per week for 18–24 year olds on average, compared to just over six hours for the total adult population.

In the week prior to the survey, an estimated 10.4 million people aged 18 years and over (or 61% of adults) worked in a job or business. These workers spent an average of just over 16 hours sitting at work. Within occupation groups, Professionals, Clerical and Administrative workers and Managers spent the most time being sedentary at work, averaging between 22 and 23 hours of sitting at work in the last week, with Machinery Operators and Drivers the next most sedentary averaging over 19 hours. In terms of proportion of work time spent sitting, Clerical and Administrative workers were the most sedentary occupation group with the majority (64%) spending at least three-quarters of their time at work sitting, followed by Professionals, half of whom spent at least three-quarters of their work time sitting. The least sedentary occupation group was Labourers, who averaged just under 4 hours sitting in the last week, and 90% reported spending less than one-quarter of their work time sitting in the last week.

  1. Employed persons who worked in the last week

Overall, working adults spent an average 22 hours and 10 minutes per week in a combination of sitting for work and travel purposes. The amount of sedentary work and travel time was closely associated with income. The average time spent sitting at work and transport for workers in the fifth quintile (top 20%) of equivalised income households was 30 hours and 23 minutes per week, around twice as long as adults from the first (13 hours and 23 minutes) and second quintile (15 hours and 13 minutes per week). However, time spent in sedentary leisure activities (excluding transport) was relatively even across household income groups (averaging between around 19 and 21 hours). This meant that in combined work and leisure, working adults in the highest household income group spent almost 51 hours per week in sedentary activity compared with the average of just over 40 hours for all other quintiles. On the other hand, adults in the highest income quintile also spent over an hour longer doing physical activity than people in the other quintiles (4 hours and 40 minutes compared with 3 hours and 31 minutes) per week.

  1. worked in last week

Pedometer steps

The majority of physical activity data collected in the Australian Health Survey was collected via self-report methods specifying the length of time undertaken and level of intensity. To complement this, pedometer data was collected as an objective measure to quantify the volume of physical activity undertaken. Although the data does not indicate a level of intensity (such as whether the activity level is low, moderate or high) it can provide an insight into general levels of incidental and intended physical activity.

Pedometer data: sources, definitions and interpretation

Young people aged 5-17 years

In 2011-12, the children and young people who participated in the pedometer study, recorded an average of 9,140 steps per day. Males recorded more steps than females with one in four males (25%) achieving the threshold of 12,000 steps per day (on average) compared with only 8% of females. The difference between males and females was more marked in the younger age groups.

See Table 25: Average pedometer steps per day, Children aged 5–17 years and Table 26: Average pedometer steps per day type by selected characteristics, Children aged 5–17 years.

Adults

Adults took less steps than children with an average of 7,400 steps per day. Less than one in five adults (19%) recorded 10,000 per day on average, with 35–44 year olds being most likely (25%) to reach the threshold. See Table 23: Average pedometer steps per day, Persons aged 18 years and over and Table 24: Average pedometer steps per day type by selected characteristics, Persons aged 18 years and over.

Data downloads

Table 1: Summary activity indicators by age then sex, persons aged 18 years and over

Table 2: Summary activity indicators by age then sex, children aged 5-17 years

Table 3: Summary activity indicators by sex, children aged 2-4 years

Table 4: Sufficient physical activity measure by selected population characteristics, persons aged 18 years and over

Table 5: Average time spent on physical activity and sedentary behaviour by selected population characteristics, persons aged 18 years and over

Table 6: Sufficient physical activity measure by health characteristics, persons aged 18 years and over

Table 7: Average time spent on physical activity and sedentary behaviour by health characteristics, persons aged 18 years and over

Table 8: Type of physical activity, persons aged 18 years and over

Table 9: Type of sedentary behaviour, persons aged 18 years and over

Table 10: Frequency and duration of physical activity, persons aged 18 years and over

Table 11: Frequency and duration of vigorous gardening and strength/toning activity, persons aged 18 years and over

Table 12: Duration of sedentary behaviour, persons aged 18 years and over

Table 13: Type of occupation by proportion of work time spent sitting, employed persons aged 18 years and over

Table 14: Whether met physical and screen-based activity recommendations by selected population characteristics, children aged 2-17 years

Table 15: Average days met physical and screen-based activity recommendations, children aged 2-17 years

Table 16: Number of days met physical and screen-based activity recommendations by sex and age, children aged 2-17 years

Table 17: Type of screen-based items located in bedrooms and screen-based household rules, children aged 2-17 years

Table 18: Type of physical activity and sedentary screen-based activity, children aged 5-17 years

Table 19: Average time spent on physical activity, children aged 5-17 years

Table 20: Average time spent on sedentary screen-based activity, children aged 5-17 years

Table 21: Type of physical activity and sedentary screen-based activity, children aged 2-4 years

Table 22: Average time spent on physical activity and sedentary screen-based activity, children aged 2-4 years

Table 23: Average pedometer steps per day, persons aged 18 years and over

Table 24: Average pedometer steps per day type by selected characteristics, persons aged 18 years and over

Table 25: Average pedometer steps per day, children aged 5-17 years

Table 26: Average pedometer steps per day type by selected characteristics, children aged 5-17 years

All data cubes

History of changes

Show all

About the Australian Health Survey

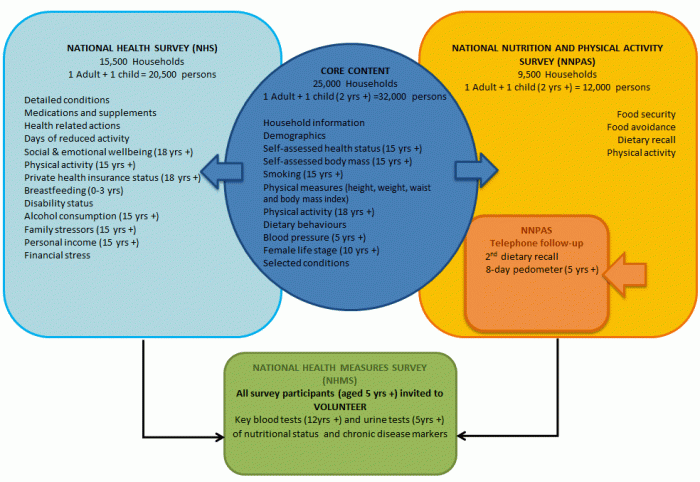
The 2011-13 Australian Health Survey (AHS) is the largest and most comprehensive health survey ever conducted in Australia. The survey was designed to collect a range of information from Australians about health related issues, including: health status, risk factors, socioeconomic circumstances, health-related actions and use of medical services. In 2011-13, the AHS collected new information on nutrition and physical activity. It also included the first national biomedical information collection of adults and children.

These new components in the health survey were made possible by additional funding from the Australian Government Department of Health and Ageing as well as the National Heart Foundation of Australia. The contributions of these two organisations to improving health information in Australia through quality statistics are greatly valued.

Results presented in this publication, by selected population and health risk characteristics, include:

  • physical activity
  • sedentary behaviour (including screen-based activity)
  • screen-based equipment and household rules
  • pedometer steps.


The statistics presented in this release are indicative of the extensive and diverse range of data available and demonstrate some of the analytical potential of the survey results. Further results will be released progressively through 2013-14 and will cover topics such as:

  • detailed information on dietary intake
  • information on biomedical health measures
  • representative results for the Aboriginal and Torres Strait Islander population.


The 2011-13 AHS was developed with the assistance of an advisory group comprised of experts in health issues. Members of this advisory group were drawn from Commonwealth and state/territory government agencies, non-government organisations and relevant academic institutions. The valuable contributions made by members of the survey advisory group are greatly appreciated.

Finally, the success of the 2011-13 AHS was dependent on the very high level of cooperation received from the Australian public. Their continued cooperation is very much appreciated; without it, the range of statistics published by the ABS would not be possible. Information received by the ABS is treated in strict confidence as required by the Census and Statistics Act 1905.

The structure of the Australian Health Survey

Release schedule

Results from the Australian Health Survey have been released progressively from October 2012 and will continue into 2015. Please see the Australian Health Survey: Users' Guide, 2011-13 (cat. no. 4363.0.55.001) and the Australian Aboriginal and Torres Strait Islander Health Survey: Users' Guide, 2012-13 (cat. no .4727.0.55.002) for more information on the release schedule.

Previous catalogue number

This release previously used catalogue number 4364.0.55.004.

Back to top of the page