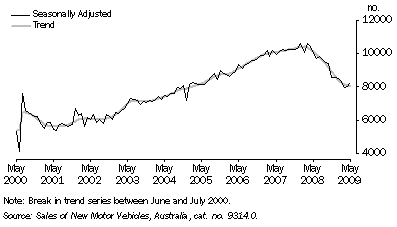
NEW MOTOR VEHICLE SALES
- Sales of new motor vehicles (trend) have declined for fifteen consecutive months in Western Australia after peaking at 10,381 in February 2008. In May 2009, new motor vehicles sales (8,055) were 2.4% lower than in February 2009 and 22% lower than in February 2008.
- This overall decline in motor vehicle sales in the three months to May 2009, was driven by continuing falls in the sale of passenger vehicles and utilities, vans, trucks, buses and other commercial vehicles.
- By contrast, sales of sports utility vehicles increased from 1,748 in February 2009 to 1,812 in May 2009 (3.7%), after falling over the previous year.
New Motor Vehicle Sales

2 New Motor Vehicle Sales, by type of vehicle: Trend |
|
 |  | Passenger
vehicles | Sports
utility
vehicles | Other
vehicles | Total
vehicles |
| Month | no. | no. | no. | no. |
Trend |
|
| 2008 |  |  |  |  |
 | March | 5 492 | 2 243 | 2 597 | 10 332 |
 | April | 5 470 | 2 196 | 2 559 | 10 225 |
 | May | 5 446 | 2 133 | 2 509 | 10 088 |
 | June | 5 401 | 2 070 | 2 467 | 9 938 |
 | July | 5 307 | 2 018 | 2 448 | 9 772 |
 | August | 5 161 | 1 972 | 2 450 | 9 583 |
 | September | 4 995 | 1 926 | 2 450 | 9 371 |
 | October | 4 839 | 1 876 | 2 424 | 9 139 |
 | November | 4 701 | 1 818 | 2 356 | 8 875 |
 | December | 4 595 | 1 770 | 2 251 | 8 616 |
| 2009 |  |  |  |  |
 | January | 4 512 | 1 746 | 2 148 | 8 407 |
 | February | 4 440 | 1 748 | 2 068 | 8 256 |
 | March | 4 371 | 1 764 | 2 014 | 8 149 |
 | April | 4 308 | 1 785 | 1 980 | 8 073 |
 | May | 4 270 | 1 812 | 1 973 | 8 055 |
|
| Source: Sales of New Motor Vehicles, Australia, cat. no. 9314.0. |
To view Excel spreadsheet:
New Motor Vehicle Sales
 Print Page
 Print All