PRIVATE NEW CAPITAL EXPENDITURE
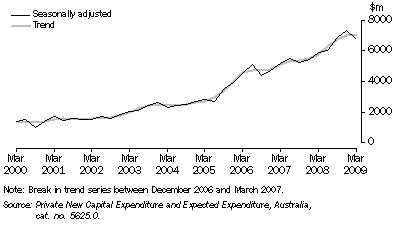
- Western Australia's private new capital expenditure, in trend chain volume terms, was just over $7 billion in the March quarter 2009. However, increases in expenditure in the last three quarters have slowed from a peak of 8.9% in June 2008 to 1.3% for March 2009. Nationally, private new capital expenditure fell by 0.7% in the March quarter 2009.
- The easing of private capital expenditure growth in trend terms resulted from significant falls in original and seasonally adjusted data series. A 23% contraction in original terms for the March quarter 2009, following a rise of 24% in the previous quarter, translates to a seasonally adjusted decrease of 8% from its peak in December.
- In trend terms, there was an increase in investments in buildings and structures, which accounted for just over $5 billion of the $7 billion in new private capital expenditure. In contrast, expenditure on equipment, plant and machinery decreased to just under $2 billion.
Private New Capital Expenditure, Chain volume measures

1 Private New Capital Expenditure, by type of asset - Chain volume measures(a): Trend |
|
 |  | Trend
|
 |  | Buildings
and
structures | Equipment,
plant and
machinery | Total |
| Reference period | $m | $m | $m |
|
| 2006-2007 | (b)13 384 | (b)6 486 | (b)19 859 |
| 2007-2008 | 14 788 | 8 025 | 22 816 |
| 2007 |  |  |  |
 | December | 3 568 | 1 898 | 5 466 |
| 2008 |  |  |  |
 | March | 3 666 | 2 072 | 5 737 |
 | June | 4 007 | 2 241 | 6 248 |
 | September | 4 472 | 2 238 | 6 707 |
 | December | 4 870 | 2 118 | 6 986 |
| 2009 |  |  |  |
 | March | 5 080 | 1 966 | 7 074 |
|
| (a) Reference year for chain volume measures is 2006-07. |
| (b) Break in series between December 2006 and March 2007. |
| Source: Private New Capital Expenditure and Expected Expenditure, Australia, cat. no. 5625.0. |
- In the March quarter, the mining industry continued to account for a significant proportion (77%) of all private capital investment in Western Australia (original data).
- New capital expenditure on mining was, however, significantly lower than in the previous quarter (down 22%) in original terms and therefore reduced total private new capital expenditure. By contrast, private new capital expenditure for the December quarter 2008 ($8.6 billion in original terms) was the highest recorded since the series began in June 1989, with the industries of mining and manufacturing, particularly, at their highest levels.
2 Private New Capital Expenditure, by industry - Current prices: Original |
|
 |  | Mining | Manufacturing | Other
selected
industries | Total |
| Reference period | $m | $m | $m | $m |
|
| 2006-2007 | 13 542 | 1 492 | 4 683 | 19 717 |
| 2007-2008 | 17 111 | 1 653 | 4 428 | 23 191 |
| 2007 |  |  |  |  |
 | December | 4 250 | ^481 | ^1 280 | 6 011 |
| 2008 |  |  |  |  |
 | March | 4 264 | ^409 | 904 | 5 577 |
 | June | 4 995 | ^445 | 1 141 | 6 580 |
 | September | 5 383 | ^409 | 1 107 | 6 899 |
 | December | 6 611 | 532 | ^1 504 | 8 647 |
| 2009 |  |  |  |  |
 | March | 5 132 | 435 | ^1 057 | 6 623 |
|
| ^ estimate has a relative standard error of 10% to less than 25% and should be used with caution |
| Source: Private New Capital Expenditure and Expected Expenditure, Australia, cat. no. 5625.0. |
To view Excel spreadsheet:
Private New Capital Expenditure
 Print Page
 Print All