RETAIL
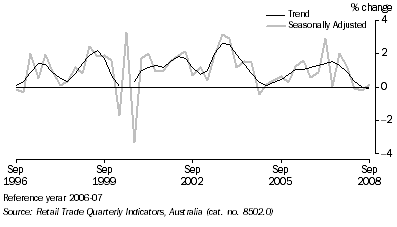
Retail Trade, (from Table 3.2) Chain Volume Measures
- Percentage change from previous quarter

Retail Trade, By industry group - Chain Volume Measures(a) |
|  |
| Period | Food retailing | Department stores | Clothing and soft good retailing | Household good retailing | Other retailing | Cafes, restaurants and takeaway food services | Total |  |
Annual ($ million) |  |
|  |
| 2005-06 | 78 926.0 | 16 734.1 | 13 635.7 | 31 853.1 | 28 869.8 | 23 989.0 | 193 933.0 |  |
| 2006-07 | 81 147.5 | 17 254.3 | 14 549.4 | 34 854.7 | 29 806.0 | 25 279.3 | 202 891.2 |  |
| 2007-08 | 83 952.9 | 17 886.3 | 15 348.6 | 37 291.8 | 32 082.1 | 25 381.2 | 211 942.9 |  |
Percentage change from previous year |  |
|  |
| 2005-06 | 2.5 | 0.1 | 5.9 | 6.3 | -3.4 | 1.7 | 2.1 |  |
| 2006-07 | 2.8 | 3.1 | 6.7 | 9.4 | 3.2 | 5.4 | 4.6 |  |
| 2007-08 | 3.5 | 3.7 | 5.5 | 7.0 | 7.6 | 0.4 | 4.5 |  |
Seasonally adjusted ($ million) |  |
|  |
| 2006-2007 |  |  |  |  |  |  |  |  |
 | September | 19 879.4 | 4 235.9 | 3 552.2 | 8 376.0 | 7 430.1 | 6 181.0 | 49 677.7 |  |
 | December | 20 029.7 | 4 270.6 | 3 598.6 | 8 532.5 | 7 473.0 | 6 199.7 | 50 099.6 |  |
 | March | 20 616.0 | 4 395.9 | 3 672.9 | 8 977.4 | 7 501.3 | 6 418.4 | 51 547.8 |  |
 | June | 20 622.4 | 4 351.9 | 3 725.6 | 8 968.9 | 7 401.6 | 6 480.2 | 51 566.0 |  |
| 2007-2008 |  |  |  |  |  |  |  |  |
 | September | 20 818.2 | 4 486.4 | 3 817.0 | 9 239.7 | 7 693.6 | 6 521.7 | 52 576.5 |  |
 | December | 21 134.1 | 4 452.3 | 3 831.3 | 9 340.7 | 8 004.2 | 6 429.3 | 53 191.9 |  |
 | March | 20 973.9 | 4 488.4 | 3 868.1 | 9 337.6 | 8 202.6 | 6 267.8 | 53 138.3 |  |
 | June | 21 026.7 | 4 459.2 | 3 832.3 | 9 373.9 | 8 181.5 | 6 162.5 | 53 036.2 |  |
| 2008-2009 |  |  |  |  |  |  |  |  |
 | September | 21 125.0 | 4 507.6 | 3 893.5 | 9 373.5 | 8 150.6 | 6 053.8 | 53 104.0 |  |
Percentage change from previous quarter |  |
|  |
| 2006-2007 |  |  |  |  |  |  |  |  |
 | June | 0.0 | -1.0 | 1.4 | -0.1 | -1.3 | 1.0 | 0.0 |  |
| 2007-2008 |  |  |  |  |  |  |  |  |
 | September | 0.9 | 3.1 | 2.5 | 3.0 | 3.9 | 0.6 | 2.0 |  |
 | December | 1.5 | -0.8 | 0.4 | 1.1 | 4.0 | -1.4 | 1.2 |  |
 | March | -0.8 | 0.8 | 1.0 | 0.0 | 2.5 | -2.5 | -0.1 |  |
 | June | 0.3 | -0.6 | -0.9 | 0.4 | -0.3 | -1.7 | -0.2 |  |
| 2008-2009 |  |  |  |  |  |  |  |  |
 | September | 0.5 | 1.1 | 1.6 | 0.0 | -0.4 | -1.8 | 0.1 |  |
|  |
| (a) Reference year 2006-07. |
| Source: Retail Trade Quarterly Indicators, Australia, (cat. no. 8502.0) |
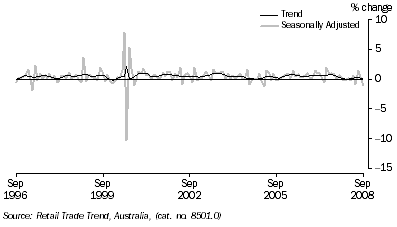
RETAIL TURNOVER, (from Table 3.3) Percentage change from previous month

Retail Turnover, By industry group(a) |
|  |
| Period | Food retailing(b) | Department stores | Clothing and soft good retailing | Household good retailing | Other retailing(c) | Cafes, restaurants and takeaway food services | Total |  |
Annual ($ million) |  |
|  |
| 2005-2006 | 75 353.9 | 16 650.5 | 13 687.0 | 32 126.3 | 28 535.4 | 23 139.8 | 189 493.0 |  |
| 2006-2007 | 81 147.5 | 17 254.3 | 14 549.4 | 34 854.6 | 29 806.0 | 25 279.4 | 202 891.4 |  |
| 2007-2008 | 87 453.4 | 18 115.9 | 15 393.5 | 36 911.2 | 32 552.3 | 26 526.2 | 216 952.3 |  |
Percentage change from previous year |  |
|  |
| 2005-2006 | 6.3 | 0.0 | 4.4 | 4.7 | -2.2 | 5.4 | 3.8 |  |
| 2006-2007 | 7.7 | 3.6 | 6.3 | 8.5 | 4.5 | 9.2 | 7.1 |  |
| 2007-2008 | 7.8 | 5.0 | 5.8 | 5.9 | 9.2 | 4.9 | 6.9 |  |
Trend ($ million) |  |
|  |
| 2007-2008 |  |  |  |  |  |  |  |  |
 | July | 7 112.0 | 1 496.6 | 1 270.8 | 3 033.4 | 2 541.6 | 2 214.5 | 17 668.9 |  |
 | August | 7 167.4 | 1 503.6 | 1 278.0 | 3 056.7 | 2 581.9 | 2 222.0 | 17 809.7 |  |
 | September | 7 213.5 | 1 508.1 | 1 282.6 | 3 078.4 | 2 626.7 | 2 226.4 | 17 935.8 |  |
 | October | 7 248.5 | 1 510.2 | 1 284.0 | 3 092.1 | 2 670.1 | 2 226.9 | 18 031.9 |  |
 | November | 7 272.9 | 1 510.9 | 1 283.6 | 3 094.9 | 2 705.4 | 2 223.0 | 18 090.6 |  |
 | December | 7 287.7 | 1 514.8 | 1 284.8 | 3 087.4 | 2 733.2 | 2 216.1 | 18 124.1 |  |
 | January | 7 299.0 | 1 518.5 | 1 287.3 | 3 074.1 | 2 752.1 | 2 209.3 | 18 140.3 |  |
 | February | 7 307.3 | 1 520.1 | 1 286.4 | 3 062.7 | 2 766.5 | 2 198.3 | 18 141.4 |  |
 | March | 7 317.4 | 1 518.5 | 1 283.5 | 3 060.7 | 2 777.1 | 2 187.5 | 18 144.7 |  |
 | April | 7 337.5 | 1 515.7 | 1 280.9 | 3 064.0 | 2 783.3 | 2 179.4 | 18 160.9 |  |
 | May | 7 369.6 | 1 513.9 | 1 280.2 | 3 068.3 | 2 785.0 | 2 176.4 | 18 193.4 |  |
 | June | 7 411.5 | 1 514.1 | 1 281.5 | 3 070.1 | 2 782.5 | 2 177.4 | 18 237.1 |  |
| 2008-2009 |  |  |  |  |  |  |  |  |
 | July | 7 459.5 | 1 516.1 | 1 284.2 | 3 063.7 | 2 778.0 | 2 180.1 | 18 281.6 |  |
 | August | 7 508.4 | 1 519.0 | 1 287.5 | 3 051.2 | 2 771.8 | 2 183.2 | 18 321.1 |  |
 | September | 7 550.7 | 1 522.5 | 1 291.4 | 3 033.1 | 2 765.9 | 2 188.2 | 18 351.9 |  |
Percentage change from previous month |  |
|  |
| 2007-2008 |  |  |  |  |  |  |  |  |
 | January | 0.2 | 0.2 | 0.2 | -0.4 | 0.7 | -0.3 | 0.1 |  |
 | February | 0.1 | 0.1 | -0.1 | -0.4 | 0.5 | -0.5 | 0.0 |  |
 | March | 0.1 | -0.1 | -0.2 | -0.1 | 0.4 | -0.5 | 0.0 |  |
 | April | 0.3 | -0.2 | -0.2 | 0.1 | 0.2 | -0.4 | 0.1 |  |
 | May | 0.4 | -0.1 | -0.1 | 0.1 | 0.1 | -0.1 | 0.2 |  |
 | June | 0.6 | 0.0 | 0.1 | 0.1 | -0.1 | 0.0 | 0.2 |  |
| 2008-2009 |  |  |  |  |  |  |  |  |
 | July | 0.6 | 0.1 | 0.2 | -0.2 | -0.2 | 0.1 | 0.2 |  |
 | August | 0.7 | 0.2 | 0.3 | -0.4 | -0.2 | 0.1 | 0.2 |  |
 | September | 0.6 | 0.2 | 0.3 | -0.6 | -0.2 | 0.2 | 0.2 |  |
|  |
| (a) There are changes to monthly retail trade statistics which are published in this table. Further information on these changes can be found in a feature article in the Retail Trade Trends, Australia, July 2008, (cat. no. 8501.0) |
| (b) From July 2008, Food retailing excludes Takeaway food retailing for all periods. |
| (c) From July 2008, Other retailing includes Recreational good retailing for all periods. |
| Source: Retail Trade Trends, Australia, (cat. no. 8501.0) |