|
|
EXPORTS
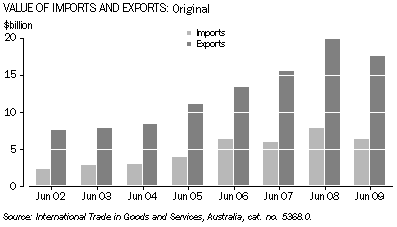
- Western Australia's trade surplus ($11 billion) in the June quarter 2009 was 8% lower than the surplus in the same quarter of the previous year.

- The value of exports from Western Australia was 12% lower in the June quarter 2009 than in the corresponding quarter of 2008, down from $20 billion to less than $18 billion.
- China was the state's main export destination, receiving goods from Western Australia to the value of $6.6 billion. This was $918 million higher than in the same quarter of the previous year, mainly due to iron ore exports.
- Over the year the value of exports to India rose by 48% to $2.2 billion. Non-monetary gold, to the value of $1.9 billion, accounted for 90% of the total value of exports to India in the June quarter 2009.
- The value of exports to Japan fell again in the June quarter, having dropped by $1.2 billion from the same quarter of the previous year. In addition, exports to the United States of America fell in value to $191 million, 70% lower than in the June quarter 2008.
1 International Merchandise Trade(a), exports - top 10 countries: original |
|
 | EXPORTS |
 | Jun 08 | Mar 09 | Jun 09 |
| Country | $'000 | $'000 | $'000 |
|
| China | 5 682 478 | 7 490 011 | 6 600 885 |
| Japan | 3 761 435 | 3 636 091 | 2 574 043 |
| India | 1 455 068 | 1 257 285 | 2 155 434 |
| Korea, Republic of | 1 545 098 | 1 670 126 | 1 365 484 |
| Singapore | 929 123 | 700 575 | 734 405 |
| Thailand | 737 008 | 334 141 | 614 654 |
| United Kingdom | 769 784 | 4 048 182 | 534 535 |
| Taiwan | 317 482 | 350 326 | 317 901 |
| Indonesia | 281 852 | 271 288 | 270 417 |
| United States of America | 648 477 | 314 728 | 191 129 |
| Total Exports(b) | 19 950 895 | 23 147 517 | 17 576 272 |
|
| (a) Free on board (f.o.b.) value |
| (b) Includes countries not listed. |
| Source: Source: ABS data available on request, International Trade in Goods and Services, Australia, cat. no. 5368.0. |
- Iron ore and concentrates and Non-monetary gold continued to be the leading exports from Western Australia, with export values of $6.8 billion and $3.3 billion respectively in the June quarter 2009.
- The export value of Iron ore and concentrates was $110 million (1.6%) higher than the value for the June quarter 2008.
- The export value of Non-monetary gold was $314 million (10.5%) higher than for the June quarter 2008.
- In contrast, Crude petroleum oils decreased in value by 47% over the same 12 month period.
2 International Merchandise Trade(a), by major commodity - original |
|
 | Jun 08 | Mar 09 | Jun 09 |
| Category of the SITC | $'000 | $'000 | $'000 |
MAJOR EXPORT COMMODITIES(b) |
|
| Iron ore and concentrates | 6 692 867 | 8 723 854 | 6 803 150 |
| Gold, non-monetary | 2 995 691 | 5 551 654 | 3 310 054 |
| Confidential items | 2 368 044 | 2 038 117 | 1 580 820 |
| Crude petroleum oils | 2 710 425 | 1 556 685 | 1 445 887 |
| Natural gas | 1 398 901 | 1 704 375 | 1 200 039 |
| Wheat | 698 948 | 829 641 | 648 613 |
| Nickel | 184 970 | 133 819 | 198 466 |
| Pigments, paints, varnishes and related materials | 90 094 | 84 434 | 143 087 |
| Liquefied propane and butane | 157 882 | 126 542 | 124 653 |
| Live animals | 70 675 | 102 705 | 121 107 |
| Nickel ores and concentrates | 393 663 | 171 231 | 118 489 |
| Ores and concentrates of base metal | 277 405 | 156 839 | 106 266 |
| Wool and other animal hair | 71 672 | 85 277 | 96 788 |
| Crustaceans, molluscs and aquatic invertebrates | 100 481 | 96 195 | 93 599 |
| Refined petroleum oils | 124 870 | 70 390 | 78 855 |
| Total exports(c) | 19 950 895 | 23 147 517 | 17 576 272 |
|
| (a) Care should be taken when comparing with commodities data prior to July 2005. For full details about changes to international trade statistics, users should refer to the Information Paper: Impact of introducing Revision 4 of the Standard International Trade Classification, 2008 (cat.no. 5368.0.55.10). |
| (b) Free on board (f.o.b.) value. |
| (c) Includes categories not listed. |
| Source: Source: ABS data available on request, International Trade in Goods and Services, Australia, cat. no. 5368.0. |
To view Excel spreadsheet: International Merchandise Trade
|
|
 Print Page
 Print All
 Print Page
 Print All