1350.0 - Australian Economic Indicators, Jan 2010  
ARCHIVED ISSUE Released at 11:30 AM (CANBERRA TIME) 23/12/2009   
   Page tools: Print Print Page  

GRAPHS

Unemployment rates, (from Table 6.4) 15-19 years looking for full time work-Trend
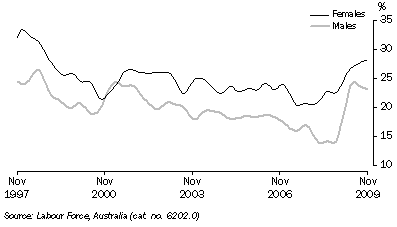
Graph: Unemployment rates, (from Table 6.4) 15–19 years looking for full time work—Trend


Unemployment rates, (from Table 6.4) 20 years and over looking for full time work-Trend
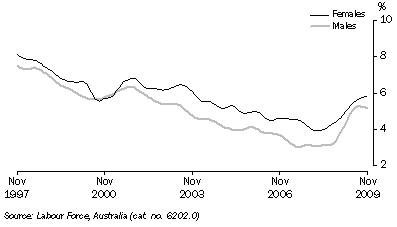
Graph: Unemployment rates, (from Table 6.4) 20 years and over looking for full time work—Trend


Population growth, (from Table 6.10)
Graph: Population growth, (from Table 6.10)


Short term visitor arrivals, (from Table 6.12)
Graph: Short term visitor arrivals from table 6.12. Showing Trend and Seasonally adjusted.


Short term resident departures, (from Table 6.12)
Graph: Short term resident departures from table 6.12. Showing Trend and Seasonally adjusted.


Standardised unemployment rates, (from Table 10.12) Seasonally adjusted
Graph: Standardised unemployment rates, seasonally adjusted from table 10.12. Showing Australia, UK, USA and Japan.


Previous PageNext Page