RETAIL
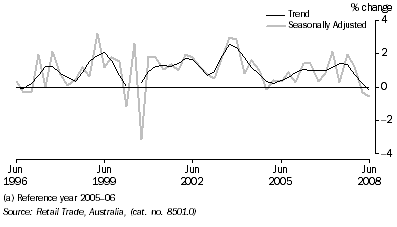
Retail Turnover, (from Table 3.2) Chain volume measures
- Percentage change from previous quarter

Retail Trade, By industry group - Chain Volume Measures(a) |
|  |
| Period | Food retailing | Department stores | Clothing and soft good retailing | Household good retailing | Recreational good retailing | Other retailing | Hospitality and service industries | Total |  |
Annual ($ million) |  |
|  |
| 2005-06 | 85 167.3 | 16 650.5 | 13 712.1 | 32 181.5 | 7 864.2 | 20 775.7 | 34 867.2 | 211 218.4 |  |
| 2006-07 | 87 330.8 | 17 168.2 | 14 639.9 | 35 237.4 | 8 069.1 | 21 567.4 | 35 582.9 | 219 595.7 |  |
| 2007-08 | 90 314.3 | 17 796.1 | 15 445.0 | 37 799.6 | 8 821.5 | 23 074.6 | 35 722.5 | 228 973.5 |  |
Percentage change from previous year |  |
|  |
| 2005-06 | 2.4 | 0.1 | 6.0 | 6.3 | -1.3 | -3.8 | 4.4 | 2.6 |  |
| 2006-07 | 2.5 | 3.1 | 6.8 | 9.5 | 2.6 | 3.8 | 2.1 | 4.0 |  |
| 2007-08 | 3.4 | 3.7 | 5.5 | 7.3 | 9.3 | 7.0 | 0.4 | 4.3 |  |
Seasonally adjusted ($ million) |  |
|  |
| 2005-2006 |  |  |  |  |  |  |  |  |  |
 | June | 21 393.4 | 4 227.1 | 3 497.1 | 8 295.6 | 1 974.0 | 5 450.2 | 8 913.8 | 53 769.3 |  |
| 2006-2007 |  |  |  |  |  |  |  |  |  |
 | September | 21 466.5 | 4 205.9 | 3 579.3 | 8 470.0 | 1 955.9 | 5 423.2 | 8 857.4 | 53 958.2 |  |
 | December | 21 592.7 | 4 274.8 | 3 638.6 | 8 643.0 | 2 044.6 | 5 381.9 | 8 817.4 | 54 393.1 |  |
 | March | 22 064.1 | 4 357.0 | 3 686.8 | 9 039.4 | 2 038.3 | 5 429.0 | 8 938.7 | 55 553.4 |  |
 | June | 22 207.4 | 4 330.5 | 3 735.2 | 9 085.1 | 2 030.3 | 5 333.3 | 8 969.4 | 55 691.0 |  |
| 2007-2008 |  |  |  |  |  |  |  |  |  |
 | September | 22 485.8 | 4 495.5 | 3 852.9 | 9 317.0 | 2 073.6 | 5 545.9 | 8 998.4 | 56 769.1 |  |
 | December | 22 696.1 | 4 470.4 | 3 868.0 | 9 419.3 | 2 201.3 | 5 753.3 | 9 046.8 | 57 455.2 |  |
 | March | 22 420.1 | 4 500.4 | 3 885.4 | 9 414.7 | 2 283.0 | 5 901.4 | 8 850.5 | 57 255.5 |  |
 | June | 22 465.2 | 4 382.2 | 3 805.9 | 9 481.5 | 2 261.7 | 5 832.9 | 8 701.1 | 56 930.5 |  |
Percentage change from previous quarter |  |
|  |
| 2006-2007 |  |  |  |  |  |  |  |  |  |
 | March | 2.2 | 1.9 | 1.3 | 4.6 | -0.3 | 0.9 | 1.4 | 2.1 |  |
 | June | 0.6 | -0.6 | 1.3 | 0.5 | -0.4 | -1.8 | 0.3 | 0.2 |  |
| 2007-2008 |  |  |  |  |  |  |  |  |  |
 | September | 1.3 | 3.8 | 3.2 | 2.6 | 2.1 | 4.0 | 0.3 | 1.9 |  |
 | December | 0.9 | -0.6 | 0.4 | 1.1 | 6.2 | 3.7 | 0.5 | 1.2 |  |
 | March | -1.2 | 0.7 | 0.4 | 0.0 | 3.7 | 2.6 | -2.2 | -0.3 |  |
 | June | 0.2 | -2.6 | -2.0 | 0.7 | -0.9 | -1.2 | -1.7 | -0.6 |  |
|  |
| (a) Reference year 2005-06. |
| Source: Retail Trade, Australia, (cat. no. 8501.0) |
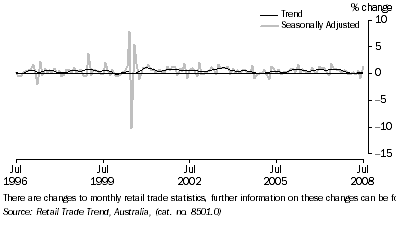
RETAIL TURNOVER, (from Table 3.3) Percentage change from previous month

Retail Turnover, By industry group(a) |
|  |
| Period | Food retailing(b) | Department stores | Clothing and soft good retailing | Household good retailing | Other retailing(c) | Cafes, restaurants and takeaway food services | Total |  |
Annual ($ million) |  |
|  |
| 2005-2006 | 75 353.9 | 16 650.5 | 13 687.0 | 32 126.3 | 28 535.4 | 23 139.8 | 189 493.0 |  |
| 2006-2007 | 81 147.5 | 17 254.3 | 14 549.4 | 34 854.6 | 29 806.0 | 25 279.4 | 202 891.4 |  |
| 2007-2008 | 87 453.4 | 18 115.9 | 15 393.5 | 36 911.2 | 32 552.3 | 26 526.2 | 216 952.3 |  |
Percentage change from previous year |  |
|  |
| 2005-2006 | 6.3 | 0.0 | 4.4 | 4.7 | -2.2 | 5.4 | 3.8 |  |
| 2006-2007 | 7.7 | 3.6 | 6.3 | 8.5 | 4.5 | 9.2 | 7.1 |  |
| 2007-2008 | 7.8 | 5.0 | 5.8 | 5.9 | 9.2 | 4.9 | 6.9 |  |
Trend ($ million) |  |
|  |
| 2006-2007 |  |  |  |  |  |  |  |  |
 | May | 7 003.8 | 1 473.5 | 1 250.1 | 3 006.7 | 2 494.1 | 2 191.3 | 17 419.5 |  |
 | June | 7 058.2 | 1 485.0 | 1 260.7 | 3 021.1 | 2 512.9 | 2 205.4 | 17 543.3 |  |
| 2007-2008 |  |  |  |  |  |  |  |  |
 | July | 7 116.4 | 1 494.5 | 1 270.0 | 3 037.0 | 2 542.2 | 2 217.2 | 17 677.3 |  |
 | August | 7 173.7 | 1 501.2 | 1 277.1 | 3 056.1 | 2 579.6 | 2 225.7 | 17 813.3 |  |
 | September | 7 219.8 | 1 506.1 | 1 282.0 | 3 073.9 | 2 622.2 | 2 229.6 | 17 933.6 |  |
 | October | 7 253.1 | 1 509.1 | 1 283.8 | 3 085.2 | 2 664.7 | 2 228.7 | 18 024.7 |  |
 | November | 7 274.6 | 1 511.0 | 1 283.9 | 3 087.6 | 2 700.6 | 2 223.3 | 18 080.9 |  |
 | December | 7 286.4 | 1 515.9 | 1 285.5 | 3 081.8 | 2 730.2 | 2 215.3 | 18 115.2 |  |
 | January | 7 295.3 | 1 520.1 | 1 288.2 | 3 071.2 | 2 752.0 | 2 208.2 | 18 135.0 |  |
 | February | 7 305.4 | 1 521.3 | 1 288.5 | 3 062.2 | 2 766.0 | 2 200.2 | 18 143.6 |  |
 | March | 7 319.7 | 1 519.5 | 1 285.7 | 3 060.3 | 2 775.6 | 2 190.2 | 18 151.0 |  |
 | April | 7 338.1 | 1 517.3 | 1 281.3 | 3 064.8 | 2 785.1 | 2 176.9 | 18 163.6 |  |
 | May | 7 357.1 | 1 516.3 | 1 276.4 | 3 076.2 | 2 795.4 | 2 161.9 | 18 183.2 |  |
 | June | 7 375.2 | 1 516.7 | 1 271.6 | 3 090.6 | 2 806.2 | 2 145.9 | 18 206.1 |  |
| 2008-2009 |  |  |  |  |  |  |  |  |
 | July | 7 391.4 | 1 518.0 | 1 267.4 | 3 109.0 | 2 814.2 | 2 131.5 | 18 231.5 |  |
Percentage change from previous month |  |
|  |
| 2007-2008 |  |  |  |  |  |  |  |  |
 | November | 0.3 | 0.1 | 0.0 | 0.1 | 1.3 | -0.2 | 0.3 |  |
 | December | 0.2 | 0.3 | 0.1 | -0.2 | 1.1 | -0.4 | 0.2 |  |
 | January | 0.1 | 0.3 | 0.2 | -0.3 | 0.8 | -0.3 | 0.1 |  |
 | February | 0.1 | 0.1 | 0.0 | -0.3 | 0.5 | -0.4 | 0.0 |  |
 | March | 0.2 | -0.1 | -0.2 | -0.1 | 0.3 | -0.5 | 0.0 |  |
 | April | 0.3 | -0.1 | -0.3 | 0.1 | 0.3 | -0.6 | 0.1 |  |
 | May | 0.3 | -0.1 | -0.4 | 0.4 | 0.4 | -0.7 | 0.1 |  |
 | June | 0.2 | 0.0 | -0.4 | 0.5 | 0.4 | -0.7 | 0.1 |  |
| 2008-2009 |  |  |  |  |  |  |  |  |
 | July | 0.2 | 0.1 | -0.3 | 0.6 | 0.3 | -0.7 | 0.1 |  |
|  |
| (a) There are changes to monthly retail trade statistics which are published in this table. Further information on these changes can be found in a feature article in the Retail Trade Trends, Australia, July 2008, (cat. no. 8501.0) |
| (b) From July 2008, Food retailing excludes Takeaway food retailing for all periods. |
| (c) From July 2008, Other retailing includes Recreational good retailing for all periods. |
| Source: Retail Trade Trends, Australia, (cat. no. 8501.0) |
 Print Page
 Print Page