ESTIMATED RESIDENT POPULATION
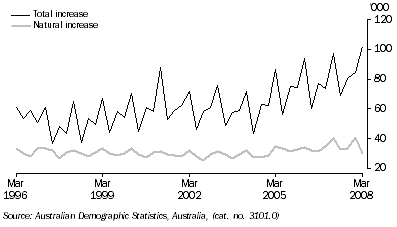
Population Growth, (from Table 6.10)

Estimated Resident Population and components of population change |
|  |
 |  | Components of population change |  |  |  |
| Period | Births | Deaths | Natural increase | Net overseas migration | Total increase | Estimated Resident Population(a) | Estimated Resident Population percent change |  |
Annual ('000) |  |
|  |
| 2004-05 | 255.9 | 131.4 | 124.6 | 123.8 | 267.4 | 20 394.8 | 1.3 |  |
| 2005-06 | 263.5 | 134.0 | 129.5 | 146.8 | 303.1 | 20 697.9 | 1.5 |  |
| 2006-07 | 274.3 | 134.8 | 139.5 | 177.6 | 317.2 | 21 015.0 | 1.5 |  |
Quarterly ('000) |  |
|  |
| 2005-2006 |  |  |  |  |  |  |  |  |
 | March | 64.6 | 30.7 | 33.9 | 53.2 | 93.8 | 20 637.9 | 0.5 |  |
 | June | 66.1 | 34.2 | 31.9 | 21.4 | 60.0 | 20 697.9 | 0.3 |  |
| 2006-2007 |  |  |  |  |  |  |  |  |
 | September | 67.3 | 35.9 | 31.4 | 45.7 | 77.2 | 20 775.1 | 0.4 |  |
 | December | 68.9 | 33.6 | 35.2 | 38.5 | 73.7 | 20 848.8 | 0.4 |  |
 | March | 71.8 | 31.8 | 40.1 | 57.0 | 97.1 | 20 945.8 | 0.5 |  |
 | June | 66.3 | 33.5 | 32.8 | 36.4 | 69.2 | 21 015.0 | 0.3 |  |
| 2007-2008 |  |  |  |  |  |  |  |  |
 | September | 73.9 | 40.2 | 33.6 | 47.2 | 80.9 | 21 095.9 | 0.4 |  |
 | December | 73.2 | 32.3 | 40.9 | 43.8 | 84.7 | 21 180.6 | 0.4 |  |
 | March | 64.8 | 34.5 | 30.3 | 71.6 | 102.0 | 21 282.6 | 0.5 |  |
|  |
| (a) Includes Other Territories from September 2003 |
| Source: Australian Demographic Statistics, Australia, (cat. no. 3101.0) |
Estimated Resident Population - At 30 June |
|  |
| At end of period | Aged 0-14 years | Aged 15-64 years | Aged 65 years and over | Total population(a) | Median Age |  |
Population ('000) |  |
|  |
| 2004-2005 | 4 022.1 | 13 735.2 | 2 637.5 | 20 394.8 | 36.5 |  |
| 2005-2006 | 4 050.4 | 13 954.8 | 2 692.7 | 20 697.9 | 36.6 |  |
| 2006-2007 | 4 075.3 | 14 174.6 | 2 765.1 | 21 015.0 | 36.8 |  |
Proportion of Population (%) |  |
|  |
| 2004-2005 | 19.7 | 67.3 | 12.9 | 100.0 | na |  |
| 2005-2006 | 19.6 | 67.4 | 13.0 | 100.0 | na |  |
| 2006-2007 | 19.4 | 67.4 | 13.2 | 100.0 | na |  |
|  |
| na not available |
| (a) Includes Other Territories. |
| Source: Australian Demographic Statistics, Australia, (cat. no. 3101.0) and ABS data on request. |
Estimated Resident Population |
|  |
| Period | New South Wales | Victoria | Queensland | South Australia | Western Australia | Tasmania | Northern Territory | Australian Capital Territory | Australia(a) |  |
Annual ('000) - Original |  |
|  |
| 2004-05 | 6 756.5 | 5 048.6 | 3 994.9 | 1 552.5 | 2 017.1 | 486.3 | 206.4 | 330.2 | 20 394.8 |  |
| 2005-06 | 6 816.1 | 5 126.5 | 4 090.9 | 1 567.9 | 2 059.4 | 490.0 | 210.6 | 334.1 | 20 697.9 |  |
| 2006-07 | 6 888.0 | 5 204.8 | 4 181.4 | 1 584.2 | 2 106.1 | 493.4 | 214.9 | 339.8 | 21 015.0 |  |
Quarterly ('000) - Original |  |
|  |
| 2005-06 |  |  |  |  |  |  |  |  |  |  |
 | March | 6 806.5 | 5 112.0 | 4 068.9 | 1 565.1 | 2 050.5 | 489.7 | 209.6 | 333.2 | 20 637.9 |  |
 | June | 6 816.1 | 5 126.5 | 4 090.9 | 1 567.9 | 2 059.4 | 490.0 | 210.6 | 334.1 | 20 697.9 |  |
| 2006-07 |  |  |  |  |  |  |  |  |  |  |
 | September | 6 836.5 | 5 146.6 | 4 109.8 | 1 572.2 | 2 070.2 | 490.6 | 211.8 | 335.1 | 20 775.1 |  |
 | December | 6 854.1 | 5 163.6 | 4 131.4 | 1 575.4 | 2 081.3 | 491.7 | 212.5 | 336.4 | 20 848.8 |  |
 | March | 6 874.6 | 5 186.8 | 4 161.4 | 1 581.1 | 2 094.9 | 492.8 | 213.8 | 338.1 | 20 945.8 |  |
 | June | 6 888.0 | 5 204.8 | 4 181.4 | 1 584.2 | 2 106.1 | 493.4 | 214.9 | 339.8 | 21 015.0 |  |
| 2007-08 |  |  |  |  |  |  |  |  |  |  |
 | September | 6 907.9 | 5 226.9 | 4 200.5 | 1 588.2 | 2 118.9 | 494.6 | 216.5 | 340.2 | 21 095.9 |  |
 | December | 6 927.0 | 5 246.1 | 4 228.3 | 1 591.9 | 2 130.8 | 495.8 | 217.6 | 340.8 | 21 180.6 |  |
 | March | 6 947.0 | 5 274.4 | 4 253.2 | 1 598.0 | 2 149.1 | 497.3 | 218.4 | 342.7 | 21 282.6 |  |
|  |
| (a) Includes Other Territories from September 1993 |
| Source: Australian Demographic Statistics, Australia, (cat. no. 3101.0) |
 Print Page
 Print Page