EMPLOYMENT
This section covers employment in the museums sector using information drawn from two sources - the 2003-04 ABS Survey of Museums and the 2006 Census of Population and Housing. When making comparisons between these sources, it is important to take into consideration the different scope and reference periods of each. Further information on how the data sources differ can be found in Chapter 5.
Survey of Museums
According to the 2003-04 survey of Museums, there were 7,624 people employed in museums during the last pay period in June 2004. Of these, 2,081 (27%) worked for Art galleries, 1,298 (17%) worked for Historic properties, 2,434 (32%) worked for Social history museums and 1,811 (24%) worked for Natural, science and other museums.
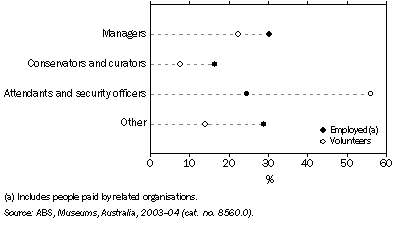
This survey also found that 20,443 people worked as volunteers for museums during the month of June 2004. Over half the volunteers (56%) were involved as museum or gallery attendants and security officers. They were less likely to be involved in managerial, administrative, research, collection management and conservation activities.
Information on volunteers was collected as an 'end-of-June 2004 snapshot', whereas information about employees was collected during the last pay period in June 2004.
8.7 MAIN TYPE OF WORK UNDERTAKEN IN MUSEUMS, By whether employed or a volunteer
- June 2004

Census of Population and Housing
The 2006 Census of Population and Housing presented a different perspective, with 6,412 people reporting that their main job (i.e. where they worked the most hours) in the week before Census Night was in the Museums industry. Of these, 41% were employed in cultural occupations such as museum and gallery attendants, curators, technicians or conservators. The 59% of museum employees not in cultural occupations included specialist managers, project and program administrators, security officers, general clerks, and education officers.
The Census identified an additional 1,136 people working in a museum-related occupation, but not in the Museums industry (e.g. a conservator working in a library). There were 315 Museum or gallery guides, 380 Museum or gallery curators, 212 Conservators, and 129 Museum and gallery technicians working in other industries.
8.8 PERSONS EMPLOYED IN MUSEUMS INDUSTRY(a)(b), By occupation - August 2006 |
|  |
 |  | Number | % |  |
|  |
 |  |  |  |
 | Museum or gallery guides | 730 | 11.4 |  |
 | Museum or gallery curators | 589 | 9.2 |  |
 | Arts administrators or managers | 292 | 4.6 |  |
 | Conservators | 171 | 2.7 |  |
 | Museum or gallery technicians | 116 | 1.8 |  |
 | Other cultural occupations | 721 | 11.2 |  |
 | Total cultural occupations | 2 619 | 40.8 |  |
 | Other occupations | 3 793 | 59.2 |  |
 | Total occupations | 6 412 | 100.0 |  |
|  |
| (a) Cells in this table have been randomly adjusted to avoid the release of confidential data. |
| (b) In their main job in the week before Census Night. |
| Source: ABS data available on request, Census of Population and Housing, 2006. |
 Print Page
 Print All