|
|
SERVICES
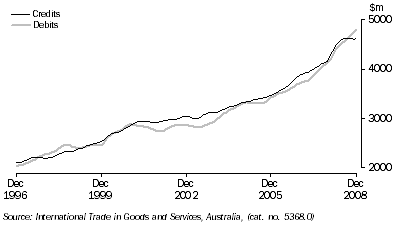
Services, (from Table 2.7) Trend

Services |
|  |
 |  |  | Credits | Debits |  |
| Period | Net services | Total services | Freight | Other trans-
portation | Travel | Other services | Total services | Freight | Other trans-
portation | Travel | Other services |  |
Annual ($ million)(a) |  |
|  |
| 2005-06 | 771 | 41 849 | 608 | 7 600 | 22 624 | 11 017 | -41 078 | -7 776 | -6 732 | -15 090 | -11 480 |  |
| 2006-07 | 1 753 | 46 181 | 609 | 8 008 | 25 161 | 12 403 | -44 428 | -8 036 | -7 324 | -15 934 | -13 134 |  |
| 2007-08 | 841 | 51 345 | 621 | 8 784 | 28 432 | 13 508 | -50 504 | -8 600 | -7 816 | -18 210 | -15 878 |  |
Monthly ($ million)(a) |  |
|  |
| 2007-2008 |  |  |  |  |  |  |  |  |  |  |  |  |
 | October | -9 | 4 229 | 56 | 658 | 2 380 | 1 135 | -4 238 | -787 | -602 | -1 559 | -1 290 |  |
 | November | 237 | 4 189 | 56 | 668 | 2 330 | 1 135 | -3 952 | -762 | -585 | -1 315 | -1 290 |  |
 | December | -157 | 4 125 | 56 | 702 | 2 225 | 1 142 | -4 282 | -707 | -697 | -1 577 | -1 301 |  |
 | January | -273 | 4 199 | 48 | 832 | 2 247 | 1 072 | -4 472 | -776 | -589 | -1 815 | -1 292 |  |
 | February | 674 | 4 512 | 48 | 816 | 2 576 | 1 072 | -3 838 | -709 | -589 | -1 242 | -1 298 |  |
 | March | 479 | 4 561 | 48 | 798 | 2 643 | 1 072 | -4 082 | -701 | -668 | -1 418 | -1 295 |  |
 | April | 212 | 4 541 | 51 | 798 | 2 468 | 1 224 | -4 329 | -746 | -617 | -1 506 | -1 460 |  |
 | May | 106 | 4 460 | 51 | 754 | 2 431 | 1 224 | -4 354 | -729 | -709 | -1 457 | -1 459 |  |
 | June | -325 | 4 313 | 53 | 743 | 2 290 | 1 227 | -4 638 | -679 | -806 | -1 653 | -1 500 |  |
| 2008-2009 |  |  |  |  |  |  |  |  |  |  |  |  |
 | July | 84 | 4 708 | 58 | 856 | 2 587 | 1 207 | -4 624 | -793 | -680 | -1 636 | -1 515 |  |
 | August | 139 | 4 659 | 58 | 832 | 2 561 | 1 208 | -4 520 | -790 | -671 | -1 536 | -1 523 |  |
 | September | -561 | 4 368 | 58 | 792 | 2 311 | 1 207 | -4 929 | -912 | -754 | -1 729 | -1 534 |  |
 | October | -206 | 4 768 | 61 | 846 | 2 560 | 1 301 | -4 974 | -1 011 | -658 | -1 624 | -1 681 |  |
 | November | 63 | 4 672 | 61 | 854 | 2 456 | 1 301 | -4 609 | -960 | -623 | -1 345 | -1 681 |  |
 | December | -417 | 4 625 | 59 | 899 | 2 363 | 1 304 | -5 042 | -941 | -762 | -1 637 | -1 702 |  |
|  |
| (a) The estimates for goods and services are not necessarily consistent with the corresponding quarterly estimates, shown in table 2.1 obtained from Balance of Payments and International Investment Position, Australia, (cat. no. 5302.0) due to data revisions to the original monthly data not feeding into the quarterly original series until the next quarterly release of Balance of Payments and International Investment Position, Australia, (cat. no. 5302.0). |
| Source: International Trade in Goods and Services, Australia, (cat. no. 5368.0) |
|
 Print Page
 Print Page