Transport and storage is vital to the Australian economy, underpinning a diverse range of industries and activities. These range from transporting and storing freight, to the movement of people by private and public transport, to vehicle hire and even the use of pipelines.
Transport and storage is not an 'industry' in the traditional sense. Industries are classified in accordance with the goods they produce, whereas transport and storage depends on the services and infrastructure provided to customers to enable the activity of carrying goods and passengers.
In national accounting terms, the contribution of an industry to the overall production of goods and services in an economy is measured by industry gross value added (GVA). Industry GVA sums the gross value added by each producer in the industry.
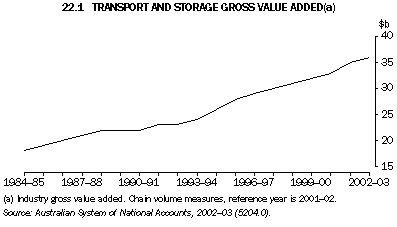
Graph 22.1 shows total production of the transport and storage industry measured by industry GVA in chain volume terms (i.e. output adjusted for price changes) has doubled between 1984-85 and 2002-03.

22.2 TRANSPORT AND STORAGE GROSS VALUE ADDED AND CONTRIBUTION TO GDP, Chain volume measures(a)
|
| Industry subdivision | Units | 1998-99 | 1999-2000 | 2000-01 | 2001-02 | 2002-03 | Percentage change from 1998-99 to 2002-03 |
|
| Industry gross value added |  |  |  |  |  |  |  |
 | Road transport | $m | 10,010 | 10,457 | 10,909 | 11,639 | 12,400 | 23.9 |
 | Air and space transport | $m | 4,747 | 5,095 | 5,508 | 5,196 | 5,400 | 13.8 |
 | Rail, pipeline and other transport | $m | 3,811 | 3,897 | 3,955 | 4,212 | 4,578 | 20.1 |
 | Transport services and storage(b) | $m | 12,081 | 12,438 | 13,108 | 13,671 | 14,003 | 15.9 |
 | Transport and storage(c) | $m | 30,602 | 31,849 | 33,447 | 34,718 | 36,382 | 18.9 |
| Contribution to GDP | % | 4.7 | 4.7 | 4.9 | 4.9 | 5.0 | . . |
|
(a) Reference year for chain volume measures is 2001-02.
(b) Includes water transport.
(c) Chain volume measures for years other than 2001-02 and 2002-03 are not additive.
Source: Australian System of National Accounts, 2002-03 (5204.0). |
 Print Page