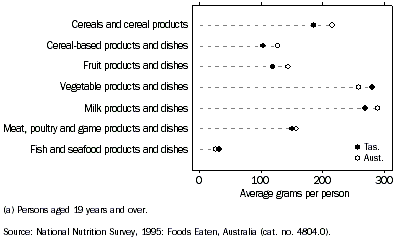
In 1995, Tasmanian adults had the lowest average intake of fruit products and dishes (119 g per day) of any State. Adults in Tasmania generally reported the lowest mean intake of most foods and beverages; however, they had a higher mean intake of vegetables and vegetable products, particularly potatoes and carrots, than adults in other States.
MEAN DAILY FOOD INTAKE(a) - 1995
|
 | Tasmania | Australia |
 |  |  |
| Selected food groups | grams per person per day | grams per person per day |
|
| Cereals and cereal products | 185 | 215 |
| Milk and milk products | 269 | 289 |
| Vegetable products and dishes | 281 | 259 |
| Meat, poultry and game products and dishes | 150 | 157 |
| Cereal-based products and dishes | 103 | 127 |
| Fruit products and dishes | 119 | 144 |
| Fish and seafood products and dishes | 31 | 26 |
(a) Persons aged 19 years and over.
Source: National Nutrition Survey, 1995: Foods Eaten Australia (cat. no. 4804.0).
|
MEAN DAILY FOOD INTAKE(a) - 1995

MEAN DAILY FOOD INTAKE(a) - 1995
|
 | Tasmania | Australia |
 |  |  |
| Selected food groups | grams per person per day | grams per person per day |
|
| Cereals and cereal products | 185 | 215 |
| Milk and milk products | 269 | 289 |
| Vegetable products and dishes | 281 | 259 |
| Meat, poultry and game products and dishes | 150 | 157 |
| Cereal-based products and dishes | 103 | 127 |
| Fruit products and dishes | 119 | 144 |
| Fish and seafood products and dishes | 31 | 26 |
(a) Persons aged 19 years and over.
Source: National Nutrition Survey, 1995: Foods Eaten Australia (cat. no. 4804.0).
|
The results of the 2001 National Health Survey show that Tasmanians consume higher levels of vegetables than the Australian average, with 15.3% of Tasmanians eating 1 serve or less of vegetables per day compared to 22.5% for all Australians. Tasmanians are more likely to consume whole milk (51.7%) compared to the Australian average (48.7%). Tasmanians are also more likely to never or rarely add salt after cooking (58.3%), compared to all Australians (54.9%).
SELECTED DIETARY HABITS - 2001(a)
|
 Usual daily serves of vegetables Usual daily serves of vegetables | Tasmania (%) | Australia (%) |
Doesn't eat vegetables/1 serve or less | 15.3 | 22.5 |
2-3 serves | 39.5 | 47.8 |
4 or more serves | 45.2 | 29.7 |
Total | 100.0 | 100.0 |
| Usual type of milk |  |  |
Whole | 51.7 | 48.7 |
Low/reduced fat | 30.6 | 29.9 |
Skim | 8.9 | 12.4 |
Soy | 2.9 | 3.9 |
Evaporated or sweetened condensed/None of the above | 5.6 | 5.3 |
Total(b) | 100.0 | 100.0 |
| Salt added after cooking |  |  |
Never/rarely | 58.3 | 54.9 |
Sometimes | 18.3 | 19.5 |
Usually | 23.5 | 25.5 |
Total | 100.0 | 100.0 |
(a) Persons aged 12 years and over.
(b) This total includes type of milk not known.
Source: National Health Survey 2001.
|
 Print Page
 Print All