JOB VACANCIES
The ABS defines a job vacancy as a job available for immediate filling on the survey reference date and for which recruitment action has been taken by the employer.
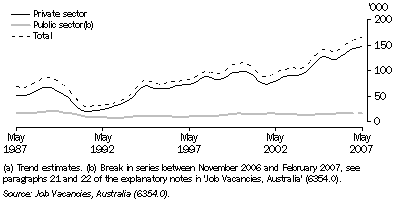
Graph 8.70 presents quarterly trend estimates of job vacancies for the period May 1987 to May 2007. It shows that the number of job vacancies decreased to 30,300 in August 1991, reflecting the labour market downturn in the early-1990s. The number of job vacancies then trended upwards to a high of 115,000 in May 2000, before falling to 88,900 in November 2001. Job vacancies then increased again, reaching a new record high of 166,000 in May 2007.
8.70 Job vacancies(a)

The number of job vacancies in May 2007 was highest in the Property and business services industry (40,500) followed by Retail trade (28,500), Manufacturing (16,000) and Health and community services (14,200) industries. Property and business services has had the highest number of job vacancies in May in each of the past five years (table 8.71).
8.71 JOB VACANCIES, By industry(a) - May |
|  |
 | 2003 | 2004 | 2005 | 2006 | 2007 |  |
 | '000 | '000 | '000 | '000 | '000 |  |
|  |
| Mining | 1.1 | 2.0 | 2.7 | 3.9 | 5.0 |  |
| Manufacturing | 10.9 | 16.1 | 14.0 | 13.0 | 16.0 |  |
| Electricity, gas and water supply | 0.3 | 0.4 | 1.0 | 0.9 | 0.9 |  |
| Construction | *5.5 | *7.1 | *9.7 | 9.6 | 7.2 |  |
| Wholesale trade | *4.1 | 7.3 | *6.6 | 11.6 | 7.6 |  |
| Retail trade | 18.1 | 21.8 | 21.1 | 21.6 | 28.5 |  |
| Accommodation, cafes and restaurants | 5.0 | *3.8 | 6.3 | 6.7 | 9.9 |  |
| Transport and storage | *1.6 | *3.0 | *4.5 | 3.1 | 4.2 |  |
| Communication services | 0.5 | 0.7 | 0.6 | *1.1 | *1.8 |  |
| Finance and insurance | 5.0 | 4.7 | 7.4 | 8.1 | 9.4 |  |
| Property and business services | *18.8 | 27.7 | 31.9 | 35.3 | 40.5 |  |
| Government administration and defence | 4.9 | 4.9 | 6.3 | 8.7 | 7.8 |  |
| Education | 5.0 | 4.5 | 4.1 | 3.6 | 4.3 |  |
| Health and community services | 12.0 | 12.1 | 14.0 | 14.9 | 14.2 |  |
| Cultural and recreational services | 3.6 | *2.0 | 3.7 | 3.9 | 3.4 |  |
| Personal and other services | *3.1 | *4.6 | *4.0 | *5.8 | *5.9 |  |
| All industries | 99.5 | 122.7 | 137.8 | 152.0 | 166.5 |  |
|  |
| * estimate has a relative standard error of 25% to 50% and should be used with caution |
| (a) Classified according to the Australian and New Zealand Standard Industrial Classification (ANZSIC), 1993 edition. |
| Source: Job Vacancies, Australia, Spreadsheets (6354.0). |
 Print Page