|
|
WATER USE AND IRRIGATION
By world standards, Australia is a dry continent with limited freshwater resources, largely due to its variable and unpredictable rainfall. More than two-thirds of the continent is classified as arid or semi-arid, making it the driest inhabited continent - Antarctica is the driest continent. Low population density means Australia has more fresh water available per person than many countries. However, Australia has one of the world's highest levels of water abstractions per person - the fourth highest of the OECD countries after the USA, Canada and New Zealand.
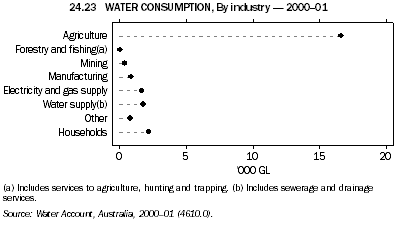
By far the largest consumer of water in Australia is the agriculture industry. Agriculture accounted for about two-thirds (67%) of total water consumption in 2000-01 (graph 24.23). Of the water used for agricultural production in 2004-05, most was for irrigation of crops and pastures (90%), the remainder was used for other agricultural purposes such as stock drinking water and piggery cleaning.
The second highest consumer of water is households, which accounted for 9% of total water use in 2000-01 (see Household water conservation practices). The water supply, sewerage and drainage services industry is also a significant consumer of water, accounting for 7% of total water consumption, followed by the electricity and gas supply industry which consumed 6.8% excluding in-stream water use for hydro-electricity generation. Mining accounted for 1.6% and manufacturing for 3.5% of total water use in 2000-01.

In 2004-05, 35,244 farms irrigated, applying a total of 10,085 gigalitres (GL) of irrigation water to 2.4 mill. ha (table 24.24). The area of crops and pastures irrigated is less than 1% of total agricultural land holdings. However, irrigated agriculture represents about 28% of the gross value of agricultural production.
24.24 IRRIGATION WATER USE - 2004-05
|
 | Agricultural
establishments
irrigating | Area
irrigated | Volume
applied | Application
rate |
 | no. | '000 ha | '000 ML | ML/ha(a) |
|
| New South Wales(b) | 8,606 | 910 | 3,716.6 | 4.1 |
| Victoria | 9,828 | 636 | 2,363.8 | 3.7 |
| Queensland | 8,258 | 542 | 2,613.4 | 4.8 |
| South Australia | 4,739 | 184 | 877.8 | 4.8 |
| Western Australia | 2,049 | 45 | 267.1 | 6.0 |
| Tasmania | 1,654 | 86 | 231.8 | 2.7 |
| Northern Territory | 110 | 4 | 14.2 | 4.0 |
| Australia | 35,244 | 2,405 | 10,084.6 | 4.2 |
|
(a) Averaged across all irrigated pastures and crops.
(b) Includes Australian Capital Territory. |
 |  |  |  |  |
| Source: Water Use on Australian Farms, 2004-05 (4618.0). |
Some crops are almost totally dependent on irrigation, while for others irrigation water supplements natural rainfall or provides moisture at critical periods of plant growth. ‘Pasture for grazing’ used the most water in 2004-05 (table 24.25). It accounted for nearly one-third of the total volume of irrigation water and also for one-third of the total area irrigated.
The most heavily irrigated crop in terms of the volume of water applied was rice, which had an average application rate of 12.1 megalitres per hectare (ML/ha) in 2004-05. This was almost three times the average rate across all crops and pastures (4.2 ML/ha). Cotton had the next highest application rate (6.7 ML/ha), followed by sugar cane (5.5 ML/ha).
24.25 PASTURES AND CROPS IRRIGATED - 2004-05
|
 | Agricultural
establishments
irrigating | Area
irrigated | Volume
applied | Application
rate |
 | no. | '000 ha | '000 ML | ML/ha(a) |
|
| Pasture for grazing | 12,101 | 842 | 2,896.5 | 3.4 |
| Pasture for seed production | 541 | 33 | 116.4 | 3.6 |
| Pasture for hay and silage | 4,449 | 151 | 579.3 | 3.8 |
| Cereal crops cut for hay | 910 | 33 | 80.2 | 2.4 |
| Cereal crops for grain or seed(b) | 2,329 | 309 | 814.4 | 2.6 |
| Cereal crops not for grain or seed | 710 | 19 | 52.9 | 2.8 |
| Rice | 774 | 51 | 619.0 | 12.1 |
| Sugar cane | 2,264 | 213 | 1,171.9 | 5.5 |
| Cotton | 668 | 270 | 1,819.3 | 6.7 |
| Other broadacre crops(c) | 937 | 63 | 177.3 | 2.8 |
| Fruit trees, nut trees, plantation or berry fruits(d) | 6,500 | 122 | 608.1 | 5.0 |
| Vegetables for human consumption | 3,791 | 109 | 419.2 | 3.8 |
| Vegetables for seed | 416 | 5 | 15.1 | 2.9 |
| Nurseries, cutflowers or cultivated turf | 2,656 | 14 | 66.3 | 4.7 |
| Grapevines | 6,808 | 147 | 591.9 | 4.0 |
| Total(e) | (f)35,244 | 2,405 | 10,085 | 4.2 |
|
(a) Averaged across all irrigated pastures or crops.
(b) Excludes rice.
(c) Excludes sugar cane and cotton.
(d) Excludes grapevines.
(e) Totals include other pastures or crops not elsewhere classified.
(f) Total does not equal the sum as many establishments grow or irrigate more than one crop. |
 |  |  |  |  |
| Source: Water Use on Australian Farms, 2004-05 (4618.0). |
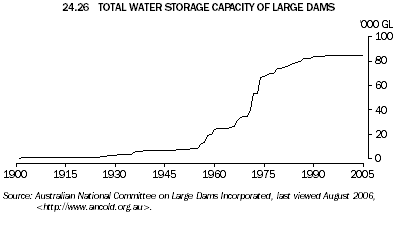
In the period since about the mid-1950s, there has been a rapid increase in the total area irrigated.
The increase in the irrigated area corresponds with the growth in total dam capacity (graph 24.26). Irrigation requires a dependable supply of water, something which cannot be supplied by the majority of Australian rivers because of the great variability in their flows. Dams have been built since the late-1800s to provide a reliable water resource for irrigation, urban water needs and hydro-electric power generation. At the start of the 20th century the combined storage capacity of all large dams was 250 GL, increasing to 9,540 GL by 1950 and 84,793 GL in 2005. Australia now has the highest per capita water storage capacity in the world, more than 4 mill. litres per person.

|
|
 Print Page