|
|
INFANT MORTALITY OVER THE LAST 100 YEARS
The survival of infants in their first year of life is commonly viewed as an indicator of the general health and wellbeing of a population1. Infant mortality refers to deaths of children under one year of age, and is measured by the infant mortality rate (IMR). IMRs indicate the level of infant deaths in a calendar year per 1,000 live births in the same calendar year. In 2004 there were 1,200 infant deaths registered in Australia.
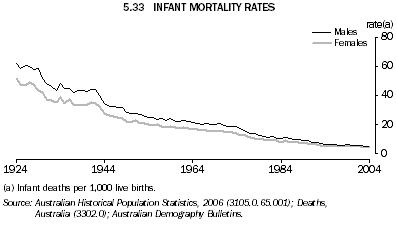
Over the last 100 years Australia's infant mortality has decreased dramatically (graph 5.33). In 1904, almost 82 infants out of every 1,000 live born babies died before their first birthday. By 2004 this had declined to 5 infant deaths per 1,000 live births. This decline largely reflects improvements in pre and post-natal care, improved sanitation, the decline in infectious diseases, drug development, and improved birth conditions1.
The improvement in the IMR has been a major contributor to increased life expectancy at birth. A baby born in the period 1901-10 was 18 times more likely to die before its first birthday than a baby born during 2002-04. Males born in 1901-10 had a life expectancy of 23 years less than males born in 2002-04 (78.1 years). For females, life expectancy in 1901-10 was 24 years less than for females born in 2002-04 (83.0 years).
Males typically experience higher IMRs than females. This is attributed mostly to biological and genetic factors1. Males in Australia have consistently recorded higher IMRs to females (graph 5.33). Australia's male IMR declined from 62 infant deaths per 1,000 births in 1924 to 5 infant deaths in 2004. Similarly, the female IMR declined from 52 infant deaths per 1,000 live births to 4 infant deaths, over the same period.

IMRs vary across the states and territories (table 5.34). However, it is important to note that for the smaller states and territories IMRs fluctuate from year to year. The Northern Territory ` consistently recorded the highest IMRs of all Australian states and territories. In 2004 the Northern Territory's IMR was 10.7 infant deaths per 1,000 live births. South Australia experienced the lowest IMR (3.2 infant deaths per 1,000 live births) in 2004.
5.34 INFANT MORTALITY RATES, By state and territory
|
 | 2002
| 2003
| 2004
|
 | Infant deaths | IMR(a) | Infant deaths | IMR(a) | Infant deaths | IMR(a) |
|
| New South Wales | 397 | 4.6 | 398 | 4.6 | 399 | 4.6 |
| Victoria | 305 | 5.0 | 309 | 5.1 | 282 | 4.5 |
| Queensland | 277 | 5.8 | 230 | 4.8 | 262 | 5.2 |
| South Australia | 90 | 5.1 | 65 | 3.7 | 54 | 3.2 |
| Western Australia | 102 | 4.3 | 100 | 4.1 | 99 | 3.9 |
| Tasmania | 37 | 6.2 | 40 | 7.0 | 21 | 3.6 |
| Northern Territory | 42 | 11.3 | 32 | 8.4 | 38 | 10.7 |
| Australian Capital Territory | 14 | 3.4 | 24 | 5.8 | 29 | 6.9 |
| Australia(b) | 1,264 | 5.0 | 1,199 | 4.8 | 1,184 | 4.7 |
|
(a) Infant deaths per 1,000 live births.
(b) Includes Other Territories. Other Territories comprise Jervis Bay Territory, Christmas Island and the Cocos (Keeling) Islands. |
| Source: Deaths, Australia, 2004 (3302.0). |
IMRs for the Indigenous population are higher than those experienced by the total population (table 5.35). For the period 2002-04 Indigenous IMRs for New South Wales, Queensland and South Australia were around double that for total persons. For Western Australia, Indigenous IMRs were three times as high as total persons. The Northern Territory experienced the highest Indigenous IMR (15.4 infant deaths per 1,000 live births) followed by Western Australia (14.1).
5.35 INFANT MORTALITY RATES(a)(b), By Indigenous origin(c)
|
 |  | New South Wales | Queensland | South
Australia | Western
Australia | Northern
Territory(d) |
|
| Indigenous persons |  |  |  |  |  |
 | 1999-2001 | 10.9 | 11.7 | 8.0 | 16.6 | 19.2 |
 | 2002-04 | 8.5 | 10.9 | 9.4 | 14.1 | 15.4 |
| Total persons |  |  |  |  |  |
 | 1999-2001 | 5.4 | 5.9 | 4.5 | 4.7 | 11.4 |
 | 2002-04 | 4.6 | 5.3 | 4.0 | 4.1 | 10.1 |
|
(a) Infant deaths per 1,000 live births.
(b) Victoria, Tasmania and the Australian Capital Territory not included due to poor coverage rates or small numbers of Indigenous infant deaths.
(c) Deaths for whom Indigenous status was not specified have not been prorated over Indigenous and non-Indigenous deaths. As a result, Indigenous and non-Indigenous infant mortality rates may be underestimated.
(d) Contribution of Indigenous deaths to total deaths is much larger in the Northern Territory than in other states. |
 |
| Source: Deaths, Australia, 2004 (3302.0). |
Australia's IMR is quite low when compared with other countries (graph 5.36). According to the United Nations, for the period 2000-05, Japan had one of the lowest IMRs (3.2 infant deaths per 1,000 births), followed by Australia (4.9), Italy (5.2), United Kingdom (5.3) and New Zealand (5.4). In comparison, Ethiopia (99.5) and Indonesia and South Africa (each 42.7) had the highest IMRs. Whilst these rates are high, these IMRs have decreased dramatically since 1950-55. Indonesia and Ethiopia experienced the largest change in IMRs from 1950-55 to 2000-05 with a decrease of 159 infant deaths per 1,000 live births and 100 infant deaths per 1,000 live births, respectively.
REFERENCE
United Nations 2000, 'World Population Monitoring 1998. Health and mortality: selected aspects', Department of Economic and Social Affairs Population Division.
|
|
 Print Page