|
|
Total energy use
In 2001-02 total energy use in Australia, comprising both primary and derived energy, was 5,055 PJ, of which around two-thirds (3,307 PJ) was delivered to end-users and the remaining third (1,747 PJ) was lost in conversion processes, transmission and distribution (diagram 17.1).
Energy conversion and supply losses
The energy conversion sectors represent an intermediate stage in the energy supply chain. These sectors transform primary energy products into more useful, higher value-added secondary (derived) energy products. Petroleum refiners, for example, transform crude oil into petroleum products such as petrol and diesel.
The main energy conversion sectors, comprising electricity generators, gas manufacturers, petroleum refiners, and operators of coke ovens and blast furnaces, are significant users of primary energy products. Of the conversion sectors, the petroleum refining and electricity generation sectors are the two main users of energy (ABARE 2004).
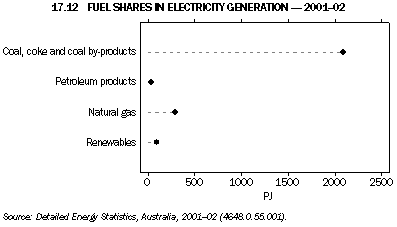
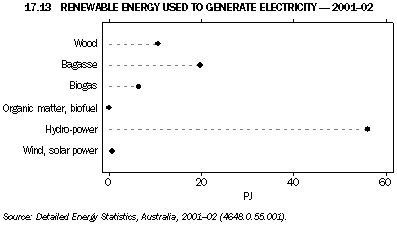
In Australia most electricity is generated from non-renewable energy sources. By energy content coal, coke and coal by-products accounted for 83% of all inputs used to generate electricity in 2001-02, natural gas accounted for 12%, and petroleum products accounted for 1% (graph 17.12). Renewable energy sources, which accounted for 4% of fuels used to generate electricity, included hydro, wind and solar (which by energy accounting definitions are considered a primary fuels), bagasse (sugar cane residue), wood, and biogas (graph 17.13).
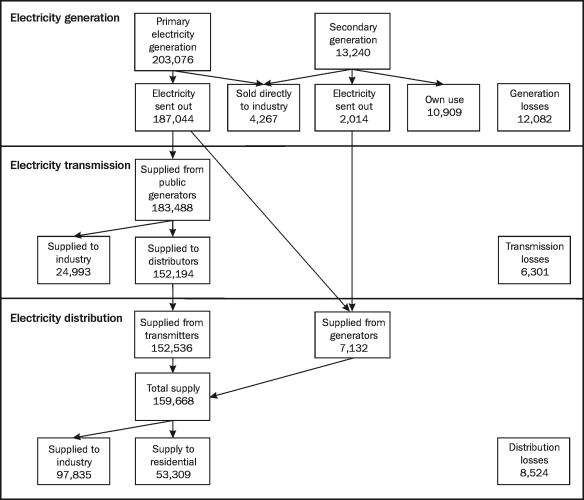
  17.14 ELECTRICITY SUPPLY(a) - 2001-02

(a) Figures are gigawatt hours. Totals do not always equal the sum of components.
Source: Detailed Energy Statistics, Australia, 2001-02 (4648.0.55.001).
Transmission and distribution pipelines transport natural gas to end-users. As with electricity, this transportation can lead to losses. Total supply losses in 2001-02 were 12,093 TJ, comprising 905 TJ of pipeline losses and 11,188 TJ of distribution losses. This represents around 1.5 % of all pipelined natural gas.
Energy end - use by sector
Australia's end-users of energy comprise households and industry (excluding the conversion sectors). End-use by industry included 136,499 GWh of electricity, 378,576 TJ of natural gas, and 4,205 kt of black coal (table 17.15). Additionally, industry end-users consumed 9,711 ML of diesel, 4,469 ML of petrol and 1,115 ML of LPG. Of the renewable energy sources, 7,408 kt of bagasse and 1,153 kt of wood and woodwaste were consumed by industry for end-use activities.
17.15 END-USE FUEL CONSUMPTION, By industry - 2001-02
|
 | Electricity | Natural gas | Petrol | Diesel | LPG | Black coal | Bagasse | Wood,
woodwaste |
 | GWh | TJ | ML | ML | ML | kt | kt | kt |
|
| Agricultural services, forestry, fishing(a) | ^417 | *98 | ^59 | ^374 | *12 | - | - | - |
| Mining | 14,118 | 52,126 | ^36 | 2,124 | 29 | 377 | - | - |
| Manufacturing | 64,506 | 268,966 | 624 | ^563 | 238 | 3,775 | 7,408 | ^1,131 |
| Electricity, gas and water supply | ^3,866 | *1,449 | 65 | ^81 | 4 | - | - | **8 |
| Construction | ^1,717 | **2,686 | 794 | ^1,047 | ^91 | - | - | **1 |
| Wholesale and retail trade | 12,811 | *6,737 | 1,122 | ^326 | ^138 |  |  | **1 |
Transport and
storage(b) | 3,532 | 10,484 | 232 | 4,207 | ^323 | *39 | - | **1 |
| Communication services | 1,531 | 304 | ^109 | *81 | **53 | - | - | **1 |
| Finance, insurance, property and business services | 6,924 | ^3,414 | 693 | *315 | ^42 |  | - | - |
| Government administration and defence(c) | 4,552 | 2,302 | 140 | 392 | 17 | *1 | - | - |
| Education | ^4,731 | 4,739 | ^53 | *22 | *21 | 2 | - | **9 |
| Health and community services | ^4,214 | ^9,766 | ^264 | *43 | *32 | 12 | - | - |
| Other services(d) | ^13,580 | ^15,505 | 277 | ^137 | ^117 | - | - | **2 |
| Total | 136,499 | 378,576 | 4,469 | 9,711 | 1,115 | 4,205 | 7,408 | ^1,153 |
|
(a) Excludes agriculture (ANZSIC Subdivision 01).
(b) Excludes water, air and space transport (ANZSIC Subdivisions 63 and 64).
(c) Excludes foreign government representatives.
(d) Includes accommodation, cafes and restaurants (ANZSIC Division H), cultural and recreational services (ANZSIC Division P), and personal and other services (ANZSIC Division Q).
Source: Detailed Energy Statistics, Australia, 2001-02 (4648.0.55.001). |
Each state and territory used different proportions of fuel types for end-use purposes (table 17.16). In 2001-02, New South Wales used more electricity, petrol, and diesel than any other state. Queensland (1,996 kt) and Western Australia (1,148 kt) together accounted for three-quarters of end-use consumption of black coal. Western Australia used 36% of Australia's natural gas (136,408 TJ).
17.16. END-USE FUEL CONSUMPTION, By state and territory - 2001-02
|
 | Electricity | Natural Gas | Petrol | Diesel | LPG | Black coal | Bagasse | Wood,
woodwaste |
 | GWh | TJ | ML | ML | ML | kt | kt | kt |
|
| New South Wales | 39,727 | ^66,015 | 1,588 | 2,932 | ^302 | 641 | - | *573 |
| Victoria | 31,697 | 79,361 | 1,150 | 1,599 | ^337 | - | - | n.p. |
| Queensland | 28,856 | 52,861 | 827 | 2,507 | ^228 | 1,996 | 7,408 | 282 |
| South Australia | 7,468 | 39,673 | ^302 | 556 | *104 | n.p. | - | 162 |
| Western Australia | 17,329 | 136,408 | ^426 | 1,608 | ^88 | 1,148 | - | **2 |
| Tasmania | 7,967 | - | ^86 | ^221 | *21 | 352 | - | n.p. |
| Northern Territory | ^2,159 | 2,878 | *32 | 167 | **21 | n.p. | - | - |
| Australian Capital Territory | 1,296 | ^1,382 | ^57 | 121 | *14 | - | - | - |
| Australia | 136,499 | 378,576 | 4,469 | 9,711 | 1,115 | 4,205 | 7,408 | ^1,153 |
|
| Source: Detailed Energy Statistics, Australia, 2001-02 (4648.0.55.001). |
In 2001-02 households used 393 PJ of energy for end-use purposes excluding transport, an increase of 17% from 1991-92 (ABARE 2004).
Australia has a very high level of motorisation and a high level of total personal travel - only United States of America and Italy are more motorised than Australia (OECD/IEA 2001). Table 17.17 shows, as a proportion of persons who work or study aged 18 years and over, the number of people driving to work or study has remained about the same between 1996 (70.1%) and 2003 (70.3%).
17.17 TYPE OF TRANSPORT TAKEN TO WORK OR STUDY, Proportion of number of persons travelling
|
 | 1996 | 2000 | 2003 |
 | % | % | % |
|
| Car/truck/van as driver | 70.1 | 72.2 | 70.3 |
| Car/truck/van as passenger | 5.0 | 5.1 | 4.2 |
| Motorbike/motorscooter | 1.0 | 0.7 | 0.6 |
| Train | 6.3 | 6.9 | 6.7 |
| Bus | 4.3 | 4.0 | 4.3 |
| Tram/light rail | 0.4 | 0.6 | 0.8 |
| Ferry/boat | 0.2 | 0.2 | 0.2 |
| Taxi | 0.2 | 0.1 | *0.1 |
| Bicycle | 1.8 | 1.1 | 1.2 |
| Walk | 4.3 | 4.2 | 3.9 |
| Other | 0.3 | 0.3 | *0.1 |
| Do not travel (work/study at home) | 6.2 | 4.8 | 7.5 |
|
| Source: Environmental Issues: People's Views and Practices (4602.0). |
The 1970s and 1980s saw a significant increase in the level of indoor comfort and amenities in Australian homes for space comfort, water heating and electric appliances. Natural gas and electricity are the key sources of space heating (table 17.18). In 2002 natural gas was the main heating source for 34% of residences (up from 31% in 1994); electricity provided 31% and wood 14%. Over 19% of households did not have space heating. As comfort standards have increased and pipeline gas became more widely available, whole house heating rather than 'spot' heating has increased (OECD/IEA 2001). Electricity is the major source of energy for both heating water (about 61% in 2002) and cooking (about 57% in 2002).
17.18 PRINCIPAL FUEL TYPES USED IN DWELLINGS, Number of dwellings by purpose
|
 | Room heating | Water heating | Cooking(a) |
 |
|
|
|
 | 1994 | 1999 | 2002 | 1994 | 1999 | 2002 | 1999 | 2002 |
 | '000 | '000 | '000 | '000 | '000 | '000 | '000 | '000 |
|
| Electricity | 1,906.4 | 1,997.3 | 2,309.2 | 3,999.3 | 4,253.8 | 4,588.0 | 4,181.1 | 4,270.0 |
| Gas | 2,044.3 | 2,349.6 | 2,555.0 | 2,153.8 | 2,526.7 | 2,810.1 | 2,887.0 | 3,169.1 |
| Wood | 1,130.4 | 1,118.3 | 1,024.2 | (b) | 73.9 | 44.9 | 51.4 | 34.6 |
| Solar | 3.8 | *0.8 | *1.0 | 317.1 | 344.7 | 322.4 | - | - |
| Oil | 200.0 | 156.3 | 92.6 | (b) | 2.2 | *1.9 | 0.9 | - |
| Coal/coke | (b) | *2.7 | *1.3 | (b) | - | *0.6 | - | - |
| Other | 90.6 | 44.5 | 31.6 | 141.9 | 12.4 | 15.3 | 14.8 | - |
| Don't know | (b) | *7.5 | - | (b) | 36.9 | 117.6 | - | - |
| None | 1,039.1 | 1,458.1 | 1,458.7 | - | - | - | - | - |
| Total | 6,414.5 | 7,135.2 | 7,473.7 | 6,612.1 | 7,250.6 | 7,473.7 | 7,135.2 | 7,473.7 |
|
(a) Not collected in 1994.
(b) Included in Other.
Source: Environmental Issues: People's Views and Practices (4602.0). |
Indicators of energy use
Australia's total energy consumption increased by 6% from 1997-98 to 2001-02. In this period the population increased by 5%, and gross domestic product (GDP) by almost 16%. Consequently, there has been a continuing decline in Australia's aggregate energy intensity, that is, energy consumed per unit of GDP over the five-year period. While electricity use marginally outgrew population growth over the period, it broadly matched growth in GDP (table 17.19).
17.19 SELECTED ENERGY INDICATORS
|
 | Energy consumption(a) | Electricity use(b) | Population | GDP(b) | Energy use per person | Electricity use per person | Energy
use/GDP | Electricity
use/GDP |
 | PJ | PJ | '000 | $m | GJ/person | GJ/person | GJ/$m | GJ/$m |
|
| 1997-98 | 4,777.6 | 703.6 | 18,711.3 | 616,805 | 255.3 | 37.6 | 7,746 | 1,141 |
| 1998-99 | 4.884.3 | 734.3 | 18,925.9 | 649,550 | 258.1 | 38.8 | 7,520 | 1,130 |
| 1999-2000 | 4,971.0 | 756.8 | 19,153.4 | 673,944 | 259.6 | 39.5 | 7,376 | 1,123 |
| 2000-01 | 5,004.4 | 779.9 | 19,413.2 | 687,720 | 257.8 | 40.2 | 7,277 | 1,134 |
| 2001-02 | 5,054.7 | 808.2 | 19,641.0 | 714,370 | 257.4 | 41.1 | 7,076 | 1,131 |
|
(a) Primary plus derived energy.
(b) Chain volume measures, reference year is 2001-02.
Source: Australian Demographic Statistics (3101.0); Australian System of National Accounts (5204.0); Detailed Energy Statistics, Australia, 2001-02 (4648.0.55.001); ABARE, electronic datasets, Tables A and F. |
|
 Print Page