RETAIL
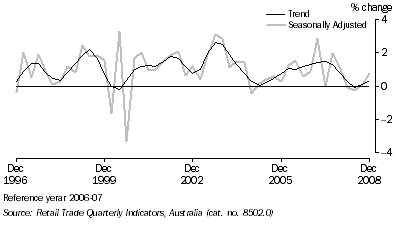
Retail trade, (from Table 3.2) Chain volume measures
- Percentage change from previous quarter

Retail trade, By industry group - Chain volume measures(a) |
|
| Period | Food retailing | Department stores | Clothing and soft good retailing | Household good retailing | Other retailing | Cafes, restaurants and takeaway food services | Total |
Annual ($ million) |
|
| 2005-06 | 78 926.0 | 16 734.1 | 13 635.7 | 31 853.1 | 28 869.8 | 23 989.0 | 193 933.0 |
| 2006-07 | 81 147.5 | 17 254.3 | 14 549.4 | 34 854.7 | 29 806.0 | 25 279.3 | 202 891.2 |
| 2007-08 | 83 952.9 | 17 886.3 | 15 348.6 | 37 291.8 | 32 082.1 | 25 381.2 | 211 942.9 |
Percentage change from previous year |
|
| 2005-06 | 2.5 | 0.1 | 5.9 | 6.3 | -3.4 | 1.7 | 2.1 |
| 2006-07 | 2.8 | 3.1 | 6.7 | 9.4 | 3.2 | 5.4 | 4.6 |
| 2007-08 | 3.5 | 3.7 | 5.5 | 7.0 | 7.6 | 0.4 | 4.5 |
Seasonally adjusted ($ million) |
|
| 2006-2007 |  |  |  |  |  |  |  |
 | December | 20 019.1 | 4 277.5 | 3 603.6 | 8 543.9 | 7 464.6 | 6 202.0 | 50 106.6 |
 | March | 20 617.0 | 4 397.9 | 3 671.3 | 8 983.0 | 7 502.5 | 6 423.0 | 51 560.7 |
 | June | 20 628.2 | 4 349.7 | 3 724.4 | 8 962.8 | 7 400.2 | 6 475.9 | 51 556.8 |
| 2007-2008 |  |  |  |  |  |  |  |
 | September | 20 835.4 | 4 475.7 | 3 814.2 | 9 223.9 | 7 709.6 | 6 517.1 | 52 575.9 |
 | December | 21 103.3 | 4 466.1 | 3 838.5 | 9 360.8 | 7 990.9 | 6 435.9 | 53 195.6 |
 | March | 20 979.9 | 4 488.9 | 3 865.6 | 9 343.4 | 8 202.8 | 6 272.3 | 53 152.8 |
 | June | 21 034.3 | 4 455.7 | 3 830.3 | 9 363.7 | 8 178.7 | 6 155.9 | 53 018.6 |
| 2008-2009 |  |  |  |  |  |  |  |
 | September | 21 153.0 | 4 495.6 | 3 891.5 | 9 359.1 | 8 135.0 | 6 053.4 | 53 087.5 |
 | December | 21 324.8 | 4 499.0 | 3 875.2 | 9 435.6 | 8 406.2 | 5 962.3 | 53 503.1 |
Percentage change from previous quarter |
|
| 2007-2008 |  |  |  |  |  |  |  |
 | September | 1.0 | 2.9 | 2.4 | 2.9 | 4.2 | 0.6 | 2.0 |
 | December | 1.3 | -0.2 | 0.6 | 1.5 | 3.6 | -1.2 | 1.2 |
 | March | -0.6 | 0.5 | 0.7 | -0.2 | 2.7 | -2.5 | -0.1 |
 | June | 0.3 | -0.7 | -0.9 | 0.2 | -0.3 | -1.9 | -0.3 |
| 2008-2009 |  |  |  |  |  |  |  |
 | September | 0.6 | 0.9 | 1.6 | 0.0 | -0.5 | -1.7 | 0.1 |
 | December | 0.8 | 0.1 | -0.4 | 0.8 | 3.3 | -1.5 | 0.8 |
|
| (a) Reference year 2006-07. |
| Source: Retail Trade Quarterly Indicators, Australia, (cat. no. 8502.0) |
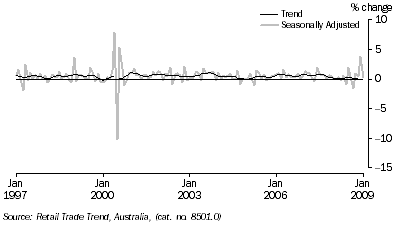
Retail turnover, (from Table 3.3) Percentage change from previous month

Retail turnover(a), By industry group |
|
| Period | Food retailing(b) | Department stores | Clothing and soft good retailing | Household good retailing | Other retailing(c) | Cafes, restaurants and takeaway food services | Total |
Annual ($ million) |
|
| 2005-2006 | 75 353.9 | 16 650.5 | 13 687.0 | 32 126.3 | 28 535.4 | 23 139.8 | 189 493.0 |
| 2006-2007 | 81 147.5 | 17 254.3 | 14 549.4 | 34 854.6 | 29 806.0 | 25 279.4 | 202 891.4 |
| 2007-2008 | 87 453.4 | 18 115.9 | 15 393.5 | 36 911.2 | 32 552.3 | 26 526.2 | 216 952.3 |
Percentage change from previous year |
|
| 2005-2006 | 6.3 | 0.0 | 4.4 | 4.7 | -2.2 | 5.4 | 3.8 |
| 2006-2007 | 7.7 | 3.6 | 6.3 | 8.5 | 4.5 | 9.2 | 7.1 |
| 2007-2008 | 7.8 | 5.0 | 5.8 | 5.9 | 9.2 | 4.9 | 6.9 |
Trend ($ million) |
|
| 2007-2008 |  |  |  |  |  |  |  |
 | November | 7 277.2 | 1 511.8 | 1 282.3 | 3 086.8 | 2 713.5 | 2 218.4 | 18 079.9 |
 | December | 7 288.1 | 1 516.0 | 1 282.7 | 3 083.1 | 2 733.1 | 2 213.1 | 18 114.9 |
 | January | 7 296.0 | 1 519.2 | 1 284.6 | 3 074.0 | 2 748.9 | 2 208.5 | 18 134.0 |
 | February | 7 300.2 | 1 519.9 | 1 283.4 | 3 067.6 | 2 764.0 | 2 199.8 | 18 137.8 |
 | March | 7 308.9 | 1 517.0 | 1 280.8 | 3 070.3 | 2 776.3 | 2 190.6 | 18 145.1 |
 | April | 7 329.2 | 1 513.9 | 1 279.9 | 3 078.0 | 2 778.9 | 2 185.9 | 18 165.7 |
 | May | 7 361.9 | 1 513.2 | 1 281.5 | 3 083.2 | 2 777.0 | 2 183.6 | 18 200.4 |
 | June | 7 409.7 | 1 514.3 | 1 283.8 | 3 079.7 | 2 776.4 | 2 182.0 | 18 245.9 |
| 2008-2009 |  |  |  |  |  |  |  |
 | July | 7 468.9 | 1 515.8 | 1 285.1 | 3 062.5 | 2 782.0 | 2 178.1 | 18 292.4 |
 | August | 7 532.9 | 1 515.7 | 1 285.0 | 3 033.3 | 2 794.5 | 2 171.8 | 18 333.1 |
 | September | 7 596.7 | 1 512.7 | 1 282.6 | 3 000.7 | 2 811.1 | 2 163.7 | 18 367.5 |
 | October | 7 658.8 | 1 507.1 | 1 278.1 | 2 969.2 | 2 830.0 | 2 155.3 | 18 398.3 |
 | November | 7 713.7 | 1 501.9 | 1 274.3 | 2 939.6 | 2 846.0 | 2 147.9 | 18 423.1 |
 | December | np | np | np | np | np | np | np |
 | January | np | np | np | np | np | np | np |
Percentage change from previous month |
|
| 2007-2008 |  |  |  |  |  |  |  |
 | May | 0.4 | 0.0 | 0.1 | 0.2 | -0.1 | -0.1 | 0.2 |
 | June | 0.6 | 0.1 | 0.2 | -0.1 | 0.0 | -0.1 | 0.3 |
| 2008-2009 |  |  |  |  |  |  |  |
 | July | 0.8 | 0.1 | 0.1 | -0.6 | 0.2 | -0.2 | 0.3 |
 | August | 0.9 | 0.0 | 0.0 | -1.0 | 0.4 | -0.3 | 0.2 |
 | September | 0.8 | -0.2 | -0.2 | -1.1 | 0.6 | -0.4 | 0.2 |
 | October | 0.8 | -0.4 | -0.4 | -1.1 | 0.7 | -0.4 | 0.2 |
 | November | 0.7 | -0.4 | -0.3 | -1.0 | 0.6 | -0.3 | 0.1 |
 | December | np | np | np | np | np | np | np |
 | January | na | na | na | na | na | na | na |
|
| na not available |
| np not available for publication but included in totals where applicable, unless otherwise indicated |
| (a) The trend series has been suspended as at November 2008. Refer to the December 2008 issue of Retail Trade, Australia, (cat. no. 8501.0) for details. |
| (b) From July 2008, Food retailing excludes Takeaway food retailing for all preiods. |
| (c) From July 2008, Other retailing includes Recreational goods retailing for all preiods. |
| Source: Retail Trade Trends, Australia, (cat. no. 8501.0) |
 Print Page
 Print Page