Feature Article - Mature age people and the labour force
This article was published in the October 2004 issue of Australian Labour Market Statistics (cat. no. 6105.0).
LABOUR FORCE CHARACTERISTICS OF MATURE AGE PEOPLE
INTRODUCTION
Australia is undergoing extensive demographic change and, as a consequence, the size and age composition of the labour force is also changing. With a relatively large number of people approaching retirement age over the next few decades, and fewer younger people entering the labour force, there is a possibility of a shortage of labour to meet future demands.
Over recent years the Commonwealth Government has released several strategic documents addressing the challenges associated with the ageing of the Australian population. One of the strategies identified by both the National Strategy for an Ageing Australia (1) and the Intergenerational Report (2) is to encourage an increased participation of mature age people in the labour force.
This article focuses on the labour force characteristics of mature age people 45-64 years, as they are most likely to move from the workforce into retirement over the next two decades. It describes their labour force participation, looks at their hours of work and where they are employed, and describes the extent to which their labour is underutilised.
LABOUR FORCE PARTICIPATION
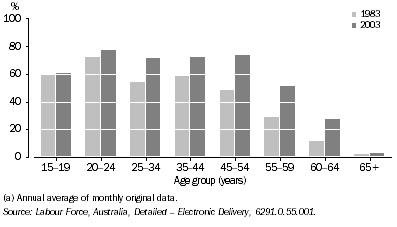
In 2003, the civilian population of Australia aged 45-64 years numbered 4.7 million. Of these, 3.3 million were in the labour force, that is, they were either employed or unemployed. The overall labour force participation rate of people aged 45-64 years has increased steadily over the last twenty years, from 56% in 1983 to 69% in 2003. This increase in participation has been driven largely by the increased participation of women in the labour force, reflecting a range of social changes, including greater acceptance of, and opportunities for, women in the workforce. In 2003, the participation rate for women aged 45-64 was 60%, well above the proportion participating in the labour force in 1983 (35%).
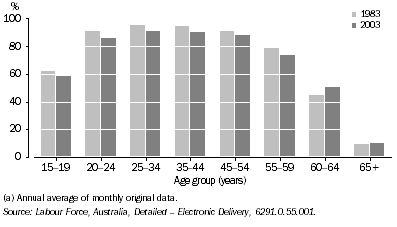
Labour force participation decreases markedly in the older age groups as some people retire or leave the labour force well before their sixties. This is reflected in lower labour force participation rates for both men and women from their forties and fifties. In 2003, most men (88%) and women (74%) aged 45-54 years were participating in the labour force. For those aged 60-64 years, the participation rates for men and women were 50% and 27% respectively.
Female Labour force participation(a)
 Male Labour force participation(a)

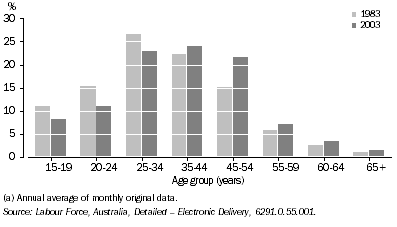
In 2003, people aged 45-64 years made up almost a third (32%) of the labour force, compared to 23% in 1983. This increase not only reflects increased labour force participation over the period, but also larger numbers of people entering this age group as the 'baby boomers' age.
Age profile of the labour force(a)

EMPLOYMENT
Hours worked
There has been a shift to part-time employment across all age groups, influenced by various changes in the economy and society. Examples of such changes include: the growth in service industries, the relaxation of trading hour restrictions, the introduction of new technologies that have allowed the extension of production schedules and operating times, and the increased participation of women in the labour force, with the associated need to balance work and family responsibilities.
The proportion of employed people aged 45-64 years working part-time increased from 16% in 1983 to 26% in 2003. People aged 24-44 years experienced a similar increase, from 17% in 1983 to 23% in 2003.
As people move into the older age groups they are increasingly likely to work part-time and this may be due, in part, to the choice made by some workers to reduce their working hours to facilitate a gradual transition to retirement. Of employed people aged 45-54 years, 8% of men and 43% of women worked part-time. The rate of part-time work was higher for employed people aged 55-64 years, with 17% of men and 52% of women working part-time in 2003. Of part-time workers aged 55-64 years, 16% wanted to work more hours, compared with 24% for those aged 45-54 years, and 27% for those aged 25-44 years.
Types of employment
In August 2003, 58% of all workers aged 45-64 years were employees with leave entitlements (excluding owner managers of incorporated enterprises), compared with 65% of workers aged 25-44 years. Owner managers formed the next largest group of workers aged 45-64 years (28%), compared with 19% of workers aged 25-44 years. The likelihood of this employment type increased with age and was more prevalent among men than women. Men aged 55-64 years were the most likely to be owner managers (40%). In comparison, just over one-quarter (26%) of employed women in this age group were owner managers.
The proportion who were employees without leave entitlements (excluding owner managers of incorporated enterprises) was slightly lower (13%) for workers aged 45-64 years than for people aged 25-44 (16%). Employed women aged 45-64 years were twice as likely (18%) to be employees without entitlements as men of that age (9%). For further information about types of employment, please see Changes in types of employment in this issue.
INDUSTRY AND OCCUPATION
Older workers generally have skills and experience gained through many years in the workforce. These workers may be concentrated in particular occupations and industries, and their retirement may have implications for recruitment and staffing levels in these occupations and industries in the future.
In 2003, the Education industry employed the highest proportion of workers aged 45-64 years (47%) followed by Health and community services (42%) and Agriculture, forestry and fishing (41%) industries. The high proportion in the Agriculture, forestry and fishing industry is consistent with the trend for fewer young people to enter farming and with farmers often working beyond the age of 65 years (see Australian Social Trends, 2003 (cat. no. 4120.0), Farming families, pp 45-49).
The highest concentrations of male workers aged 45-64 years were in the Education industry with 49% of men (108,400) working in this industry aged between 45 and 64 years, followed by Government, administration and defence (46% or 105,700) and Electricity, gas and water supply (44% or 26,500). Women aged 45-64 years were concentrated in Agriculture, forestry and fishing (representing 51,100 or 46% of all women in that industry); Education (211,300 or 46%); and Health and community services (303,700 or 42%).
Many occupations with relatively high proportions of workers aged 45-64 years are those that require higher skill levels. In the broad occupation group Managers and administrators, 46% (318,000 people) were aged 45-64 years in 2003, followed by 38% (146,200 people) in Advanced clerical and service workers and 37% (432,100 people) in the Associate professionals group.
The Professionals occupation group is a large group encompassing numerous occupations, and is the occupation group which contained the largest number of workers aged 45-64 years (640,900 people). Of these mature age workers, 12% were registered nurses, 9% were secondary school teachers and 9% were primary school teachers.
Some occupations with lesser skill requirements also contained large numbers of workers aged 45-64 years. In 2003, 485,700 Intermediate clerical, sales and service workers, and 288,900 Intermediate production and transport workers were aged between 45 and 64 years.
UNDERUTILISED LABOUR
Some people choose not to work at all for various reasons such as caring for others, studying, or retirement. Others are unable to work due to illness or injury. In addition, there are a number of people aged 45-64 years who want to work, but are not able to find that work.
Unemployment
The unemployment rate for those aged 45-64 years (3.8%) was lower than for those aged 25-44 years (5.0%). In September 2003, there were 125,700 persons aged 45-64 years who were unemployed.
As with the total unemployed population, male jobseekers aged 45-64 years were more likely to be looking for full-time work than their female counterparts (90% compared with 73%). Unemployed women aged 45-54 years were more likely than any other female age group to be seeking full-time work (74%). Similarly, unemployed men aged 45-54 years were most likely (93%) to be looking for full-time work.
Long-term unemployment
While the unemployment rate for people aged 45-64 years is relatively low, once unemployed, they tend to remain unemployed longer than their younger counterparts. In September 2003, there were 48,600 people aged 45-64 years who had been unemployed for 12 months or longer.
More than two-fifths (43%) of unemployed people aged 55-64 years had been unemployed for 12 months or longer, compared with just under one-third (33%) of 45-54 year olds and 23% of 25-44 year olds. Unemployed men were more likely to be in long-term unemployment than unemployed women. In September 2003, 45% of unemployed men aged 45-64 years had been unemployed for 12 months or longer compared with 25% of women.
Long term unemployment may make finding employment more difficult because of a loss of relevant skills and employers' perceptions of their 'employability'. This may lead to the unemployed becoming discouraged and choosing to leave the labour force altogether rather than remain unemployed.
Discouraged jobseekers
There were 41,600 people aged 45-64 who wanted to work and were available to work but did not actively look for work for labour market reasons, that is, they were discouraged jobseekers. This is considerably higher than the number for people aged 25-44 years (23,200). About half of the discouraged jobseekers aged 45-64 years (51%) reported they were discouraged because they felt they were considered too old by employers, while 22% felt there were no jobs in the locality or in their line of work, and a further 18% felt they lacked the necessary schooling, training, skills or experience.
FURTHER INFORMATION
For further information, please contact the Assistant Director, Labour Market, on Canberra 02 6252 5603.
For email enquiries, please contact Client Services on client.services@abs.gov.au.
END NOTES
1 Department of Health and Ageing (DoHA) 2002, National Strategy for an Ageing Australia, DoHA, Canberra.
2 Department of the Treasury 2002-03, Budget Paper No. 5 - Intergenerational Report, Department of the Treasury, Canberra.
 Print Page
 Print All