NOTES
**This publication has been superseded by 3310.0 - Marriages and Divorces, Australia**
ABOUT THIS RELEASE
Divorces, Australia provides information on divorces granted in Australia in 2007. Key indicators of national and state divorces, based on the location of the court granting divorce, are included in the analytical commentary. Detailed divorce tables are available in the data cube which can be accessed through the 'Downloads' tab at the top of this page. Explanatory notes, abbreviations and a glossary of terms can be accessed through the 'Explanatory Notes' tab.
Information on divorces from 2002 onwards is available in the electronic product, Divorces, Australia (cat. no. 3307.0.55.001). Information on divorces granted in 1994 to 2001 is available in Marriages and Divorces, Australia (cat. no. 3310.0). These publications are accessible from the ABS website.
INQUIRIES
For further information about these and related statistics, contact the National Information and Referral Service on 1300 135 070.
SUMMARY COMMENTARY
Selected divorce indicators - Australia: Selected years - 1988-2007 |
|  |
 |  |  | 1988 | 1998 | 2003 | 2004 | 2005 | 2006 | 2007 |  |
|  |
| Divorces granted | no. | 41 007 | 51 370 | 53 145 | 52 747 | 52 399 | 51 375 | 47 963 |  |
| Crude divorce rate(a) |  | 2.5 | 2.7 | 2.7 | 2.6 | 2.6 | 2.5 | 2.3 |  |
| Divorces involving children(b) |  |  |  |  |  |  |  |  |  |
 | Proportion of all divorces | % | 57.5 | 53.4 | 50.1 | 49.8 | 49.8 | 50.1 | 49.3 |  |
 | Average number of children per divorce(c) | no. | 1.88 | 1.88 | 1.87 | 1.87 | 1.87 | 1.88 | 1.88 |  |
| Median age at divorce |  |  |  |  |  |  |  |  |  |
 | Males | years | 37.6 | 40.5 | 42.6 | 43.0 | 43.5 | 43.9 | 44.2 |  |
 | Females | years | 34.8 | 37.8 | 39.9 | 40.3 | 40.8 | 41.1 | 41.3 |  |
| Median length of marriage |  |  |  |  |  |  |  |  |  |
 | To separation | years | 7.3 | 7.8 | 8.7 | 8.7 | 8.8 | 8.9 | 8.9 |  |
 | To divorce | years | 10.1 | 11.2 | 12.2 | 12.3 | 12.6 | 12.5 | 12.5 |  |
| Type of applicant(d) |  |  |  |  |  |  |  |  |  |
 | Male | no. | 15 280 | 16 004 | 17 229 | 16 365 | 16 020 | 15 171 | 13 216 |  |
 | Female | no. | 21 015 | 25 380 | 22 870 | 21 614 | 21 398 | 20 574 | 18 571 |  |
 | Joint | no. | 4 712 | 9 986 | 13 046 | 14 768 | 14 955 | 15 582 | 16 172 |  |
|  |
| (a) Per 1,000 estimated resident population at 30 June. See Glossary and Explanatory Notes 26 and 31 for more information. |
| (b) Unmarried children of the marriage who were aged under 18 years at the time of application for divorce. See Glossary for more information. |
| (c) Excludes divorces not involving children. |
| (d) Excludes divorces where type of applicant is not stated. |
DIVORCES GRANTED
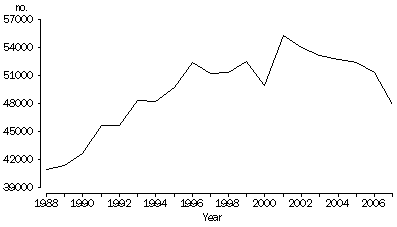
The number of divorces granted in Australia have been decreasing each year since reaching a peak in 2001.
This trend continued in 2007 with 47,963 divorces granted in comparison to 51,375 in 2006, showing a decrease of 3,412 or 6.6% over this period. The number of divorces granted in 2007 was 9.8% lower than five years ago, but only 6.6% lower than 10 years ago due to a peak in the number of divorces granted in 2001.
Divorces granted: Australia
- 1988-2007
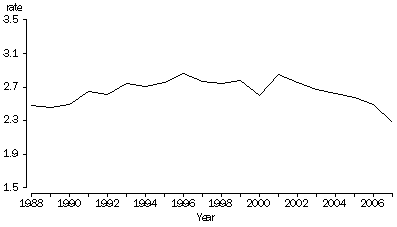
Crude divorce rate is calculated as the number of divorces granted during a calendar year per 1,000 estimated resident population at 30 June. This provides a measure of divorce in relation to the total population. Refer to the Glossary and Explanatory Notes 26 and 31 for further definition.
As the number of divorces granted decreases and the population increases in Australia, the crude divorce rate has declined steadily since 2001. In 2007, the crude divorce rate was 2.3 people granted divorce per 1,000 estimated resident population, declining from 2.5 in 2006.
Crude divorce rate: Australia
- 1988-2007
DIVORCES INVOLVING CHILDREN
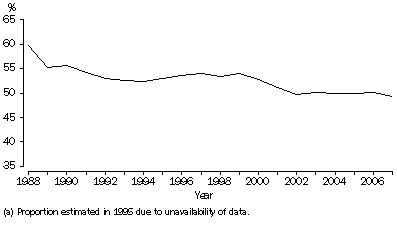
Over the last twenty years, the proportion of divorces involving children under 18 years has been decreasing, although this decline has slowed in recent years. The proportion of divorces involving children was 49.3% in 2007. The number of children affected by divorce has also decreased from 48,396 in 2006 to 44,371 in 2007, and is similar to the number of children recorded over twenty years ago.
Proportion of divorces involving children: Australia
- 1988-2007(a)
AGE AT DIVORCE
Of all females granted divorce in 2007, 62.3% were aged under 45 years. In comparison, only 52.5% of males granted a divorce were in this age group.
Age at divorce: Australia
- 2007
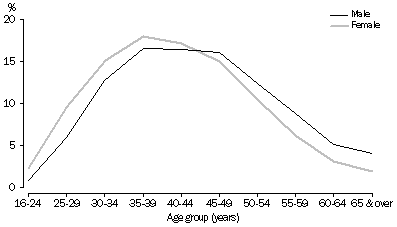
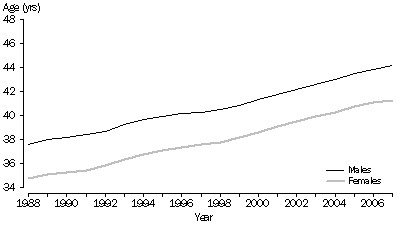
Median age for males granted divorce in 2007 was 44.2 years, compared with 41.3 years for females.
Median age at divorce has been increasing steadily for both males and females over the past 20 years. This trend continued in 2007, with median age increasing by 0.3 years for males and 0.2 years for females.
The rise in the median age at divorce may be attributed to the increasing age at marriage, the increase in the interval between marriage and divorce, and reflective of the overall ageing of the Australian population.
Median age at divorce: Australia
- 1988-2007
AGE-SPECIFIC DIVORCE RATES
Age-specific divorce rates can provide a more detailed picture of age at which people are granted divorce. These rates give an indication of the proportion of all males or females in a particular age group who were granted divorce. Further information on calculation of age-specific divorce rates is provided in the Glossary and Explanatory Notes 27-29 and 31-32.
For females, age-specific divorce rates in 2007 were highest for the 35 to 39 year age group, while among males, it was highest for the 40 to 44 year age group. This difference may reflect the tendency for females to marry at a younger age than males.
AGE-SPECIFIC DIVORCE RATES(a), Australia - Selected years - 1988-2007 |
|  |
 |  |  | 1988 | 1998 | 2003 | 2004 | 2005 | 2006 | 2007 |  |
|  |
| Male |  |  |  |  |  |  |  |  |
 | Age group (years) |  |  |  |  |  |  |  |  |
 |  | 24 and under(b) | 1.2 | 0.6 | 0.4 | 0.4 | 0.3 | 0.3 | 0.3 |  |
 |  | 25-29 | 9.4 | 7.0 | 5.3 | 4.9 | 4.5 | 4.2 | 3.9 |  |
 |  | 30-34 | 12.8 | 12.7 | 10.8 | 10.1 | 9.7 | 9.1 | 8.4 |  |
 |  | 35-39 | 12.3 | 13.3 | 12.5 | 12.5 | 11.7 | 11.2 | 10.2 |  |
 |  | 40-44 | 11.0 | 12.5 | 12.5 | 12.2 | 12.3 | 11.6 | 10.4 |  |
 |  | 45-49 | 9.2 | 11.0 | 11.6 | 11.5 | 11.5 | 11.2 | 10.2 |  |
 |  | 50-54 | 6.7 | 8.7 | 9.4 | 9.5 | 9.4 | 9.5 | 8.6 |  |
 |  | 55-59 | 4.3 | 6.0 | 7.1 | 6.8 | 7.0 | 7.0 | 6.8 |  |
 |  | 60-64 | 2.6 | 3.9 | 4.2 | 4.5 | 4.6 | 4.7 | 4.6 |  |
 |  | 65 and over | 1.1 | 1.4 | 1.5 | 1.6 | 1.7 | 1.6 | 1.6 |  |
| Female |  |  |  |  |  |  |  |  |
 | Age group (years) |  |  |  |  |  |  |  |  |
 |  | 24 and under(b) | 2.8 | 1.6 | 1.1 | 1.0 | 0.9 | 0.9 | 0.8 |  |
 |  | 25-29 | 12.7 | 11.0 | 8.5 | 8.0 | 7.3 | 7.0 | 6.4 |  |
 |  | 30-34 | 12.9 | 14.2 | 13.0 | 12.4 | 11.8 | 11.1 | 9.9 |  |
 |  | 35-39 | 11.6 | 13.2 | 13.0 | 12.9 | 12.8 | 11.9 | 11.0 |  |
 |  | 40-44 | 10.0 | 11.7 | 12.2 | 12.1 | 12.0 | 11.8 | 10.8 |  |
 |  | 45-49 | 7.8 | 9.5 | 10.4 | 10.4 | 10.3 | 10.3 | 9.4 |  |
 |  | 50-54 | 4.6 | 6.8 | 7.3 | 7.5 | 7.7 | 7.5 | 7.2 |  |
 |  | 55-59 | 2.7 | 3.9 | 4.7 | 4.7 | 4.9 | 5.0 | 4.7 |  |
 |  | 60-64 | 1.6 | 2.2 | 2.8 | 2.9 | 2.9 | 2.9 | 2.8 |  |
 |  | 65 and over | 0.4 | 0.5 | 0.6 | 0.6 | 0.6 | 0.6 | 0.6 |  |
|  |
| (a) Per 1,000 estimated resident population of the same age at 30 June. See Explanatory Notes 27-29 and 31-32 for more information. |
| (b) From 2006 onwards, males and females under 16 years are excluded from the population because they are unlikely to be married under Australian legislation. Prior to 2006, males under 16 years and females under 18 years were excluded from the population. See Explanatory Notes 27-29 and 31-32 for more information. |
LENGTH OF MARRIAGE FOR DIVORCING COUPLES
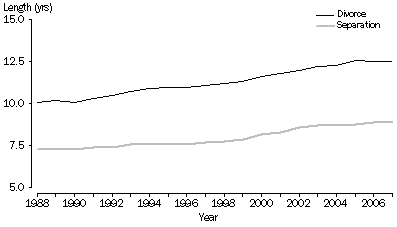
In 2007, median length of marriage to separation was 8.9 years. In comparison, the median length of marriage to separation in 2003 was 8.7 years, and in 1998 it was 7.8 years.
Median length of marriage to divorce was 12.5 years for divorces granted in 2007. In 2003, it was 12.2 years, and in 1998 it was 11.2 years.
Median length of marriage to separation and divorce has been steadily increasing over the last 20 years, although length of marriage to divorce has been increasing at a slightly faster rate than length of marriage to separation.
The difference between median length of marriage to separation and divorce was 3.6 years in 2007, compared with 3.5 years in 2003 and 3.4 years in 1998.
Median length to separation and divorce: Australia
- 1988-2007
APPLICANT FOR DIVORCE
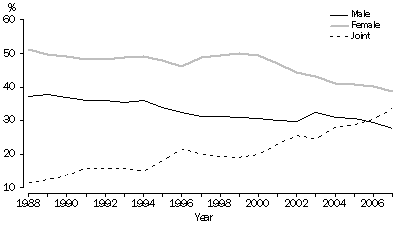
Over the last 20 years, the proportion of joint applications has been increasing, while the proportion of applications by only the male or female have decreased.
This trend has continued in 2007, with decreases of 2.0 percentage points and 1.3 percentage points respectively on the proportion of applications lodged by the male or female only. Conversely, the proportion of joint applications has increased by 3.4 percentage points in 2007.
Type of applicant: Australia
- 1988-2007
STATES AND TERRITORIES OF REGISTRATION
Divorce statistics in this publication are presented by the state or territory where the court granting divorce was located, rather than the state of usual residence of the applicants. The ABS advises caution in the interpretation of data at a state or territory level as applicants for divorce may apply through their nearest court rather than a court in their state or territory of usual residence. Refer to Explanatory Notes 20 to 25 for more information.
In 2007, there were fewer divorces granted in all states and territories across Australia compared with 2006.More divorces were granted by courts in New South Wales (13,726) than any other state. Victorian courts granted 11,833 divorces and Queensland courts granted 11,058 divorces.
Number of divorces - by jurisdiction(a): Selected years - 1988-2007 |
|  |
 | NSW | Vic. | Qld | SA | WA | Tas. | NT | ACT |  |
|  |
| 1988 | 11 880 | 10 250 | 7 690 | 4 031 | 3 964 | 1 220 | 275 | 1 697 |  |
| 1998 | 14 987 | 12 307 | 11 349 | 4 159 | 5 268 | 1 322 | 457 | 1 521 |  |
| 2003 | 16 285 | 12 865 | 10 681 | 4 151 | 5 685 | 1 336 | 490 | 1 652 |  |
| 2004 | 15 007 | 12 544 | 13 279 | 4 147 | 4 337 | 1 404 | 434 | 1 595 |  |
| 2005 | 15 172 | 12 512 | 12 383 | 3 669 | 5 265 | 1 346 | 470 | 1 582 |  |
| 2006 | 14 482 | 12 110 | 12 175 | 3 913 | 5 544 | 1 233 | 426 | 1 491 |  |
| 2007 | 13 726 | 11 833 | 11 058 | 3 534 | 4 932 | 1 127 | 417 | 1 333 |  |
|  |
| (a) Refers to state or territory location of the court granting divorce. See Explanatory Notes 20-25 for more information. |
The following table provides a summary of selected indicators of divorce granted in 2007 by the state and territory where the court granting divorce was located.
Selected divorce indicators, States and territories(a) - 2007 |
|  |
 |  |  | NSW | Vic. | Qld | SA | WA | Tas. | NT | ACT(b) | Aust.(c) |  |
|  |
| Divorces granted | no. | 13 726 | 11 833 | 11 058 | 3 534 | 4 932 | 1 127 | 417 | 1 333 | 47 963 |  |
| Crude divorce rate(d) |  | 2.0 | 2.3 | 2.6 | 2.2 | 2.3 | 2.3 | 1.9 | np | 2.3 |  |
| Divorces involving children(e) |  |  |  |  |  |  |  |  |  |  |  |
 | Proportion of all divorces | % | 46.5 | 49.6 | 51.7 | 51.5 | 48.9 | 50.4 | 45.6 | 51.8 | 49.3 |  |
 | Average number of children per divorce(f) | no. | 1.8 | 1.9 | 1.9 | 1.9 | 1.9 | 2.0 | 2.0 | 2.0 | 1.9 |  |
| Median age at divorce |  |  |  |  |  |  |  |  |  |  |  |
 | Males | years | 43.5 | 43.8 | 44.6 | 45.1 | 45.2 | 45.0 | 44.4 | 43.8 | 44.2 |  |
 | Females | years | 40.5 | 41.1 | 41.6 | 42.4 | 42.2 | 42.1 | 41.2 | 40.9 | 41.3 |  |
| Median length of marriage |  |  |  |  |  |  |  |  |  |  |  |
 | To separation | years | 7.7 | 8.8 | 9.2 | 10.4 | 9.9 | 10.1 | 8.3 | 9.6 | 8.9 |  |
 | To divorce | years | 11.2 | 12.4 | 12.9 | 14.0 | 14.0 | 13.8 | 12.8 | 12.9 | 12.5 |  |
| Type of applicant(g) |  |  |  |  |  |  |  |  |  |  |  |
 | Male | no. | 3 858 | 3 460 | 2 993 | 940 | 1 207 | 320 | 111 | 326 | 13 216 |  |
 | Female | no. | 5 209 | 4 791 | 4 324 | 1 560 | 1 644 | 485 | 132 | 424 | 18 571 |  |
 | Joint | no. | 4 658 | 3 580 | 3 741 | 1 034 | 2 080 | 322 | 174 | 583 | 16 172 |  |
|  |
| np not available for publication but included in totals where applicable, unless otherwise indicated |
| (a) Divorces are presented by the state/territory location of the court granting divorce rather than usual residence, and as such caution should be taken in comparing divorce numbers with the populations of each state/territory. See Explanatory Notes 20-25 for more information. |
| (b) Rates for the Australian Capital Territory are not published due to the high proportion of applicants from south-eastern New South Wales and Victoria who apply for divorce through Australian Capital Territory courts. See Explanatory Note 22 for more information. |
| (c) The total may be greater than the sum of its components as it includes divorces granted where the state/territory of registration was not available. |
| (d) Per 1,000 estimated resident population at 30 June. See Glossary and Explanatory Notes 26 and 31 for more information. |
| (e) Unmarried children of the marriage who were aged under 18 years at the time of application for divorce. See Glossary for more information. |
| (f) Excludes divorces not involving children. |
| (g) Excludes divorces where type of applicant is not stated. |
 Print Page
 Print All
 Quality Declaration