|
|
RESOURCES
Australia has large identified resources of fossil fuels and uranium. It is ranked in the top six countries in the world for economic demonstrated resources (EDR) of black and brown coal, and has the world's largest EDR of uranium. Australia also has significant reserves of natural gas and crude oil. For a more detailed outline on Australia's energy and mineral resources, see the Mining chapter.
Australia has substantial resources of high quality black coal. At June 2004, the EDR of black coal totalled 1,090,800 petajoules (PJ), with most of these resources located in New South Wales and Queensland. Small but locally important black coal resources occur in Western Australia, South Australia and Tasmania. Brown coal occurs mainly in Victoria with other deposits in Western Australia, South Australia and Tasmania.
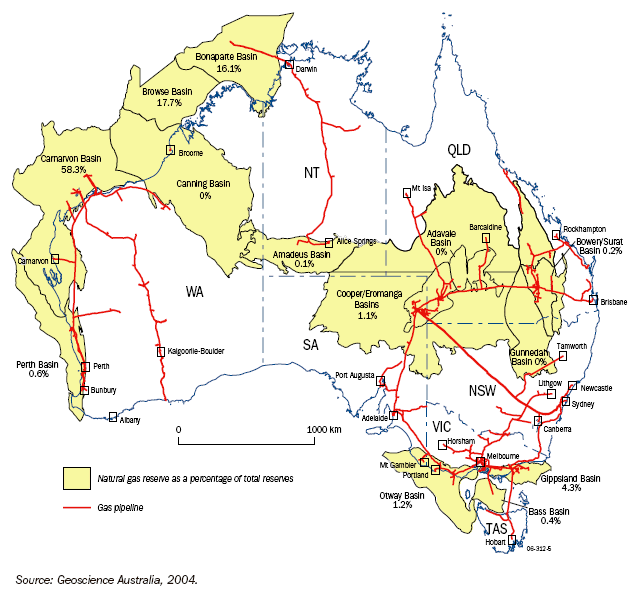
Map 17.1 shows the extent of access to gas resources and major transmission pipelines in Australia. At June 2004, the EDR of natural gas totalled 99,520 PJ, with the Carnarvon Basin accounting for over 50% of total reserves. The total length of Australia's transmission pipeline system has increased from 9,000 kilometres (km) in 1989 to almost 29,000 km in 2005. The natural gas distribution network reaches 3.7 million (mill.) customers, including 3.6 mill. domestic customers and 100,000 commercial and industrial customers.
17.1 GAS RESERVES AND PIPELINES - June 2004

In the period 1994-2004 the EDR of black coal, brown coal, and crude oil each decreased, while the EDR of liquefied petroleum gas (LPG), condensate, natural gas and uranium each increased (table 17.2). Changes in EDRs can be due to production activity and discoveries, and reclassification of resources due to reassessments (such as with black and brown coal in 1999 when some resources previously considered economic were reclassified as subeconomic).
17.2 ECONOMIC DEMONSTRATED RESOURCES OF PRIMARY ENERGY PRODUCTS(a) - 30 June
|
 | 1994 | 2004 | Change from
1994 to 2004 |
| Fuel | PJ | PJ | % |
|
| Black coal | 1,331,100 | 1,090,800 | -18.1 |
| Brown coal | 399,640 | 363,750 | -9.0 |
| Crude oil | 10,601 | 6,864 | -35.3 |
| Condensate | 5,347 | 9,287 | 73.7 |
| LPG | 4,094 | 6,864 | 67.6 |
| Natural gas | 44,360 | 99,520 | 124.3 |
| Uranium | 296,570 | 329,470 | 11.1 |
|
| (a) Non-renewable resources only. |
 |  |  |  |
| Source: Australian System of National Accounts, 2004-05 (5204.0). |
The net present value (NPV) of an energy resource is the expected value of the resource based on current market value, with some modifications based on depletion and economic forces. At June 2004, the NPV of Australian energy and mineral resources was $193 billion (b) (table 17.3). The energy resources with the highest NPV were natural gas and black coal, accounting for 41% and 25% of the total NPV of energy resources respectively. In the period 1994-2004, the value of energy resources in Australia increased from $54b to $193b (up by 357%).
17.3 NET PRESENT VALUE OF PRIMARY ENERGY RESOURCES - 30 June
|
 | 1994 | 2004 | Change from
1994 to 2004 |
| Fuel | $m | $m | % |
|
| Black coal | 7,830 | 48,889 | 624.4 |
| Brown coal | 428 | 258 | -39.7 |
| Crude oil | 17,546 | 30,587 | 174.3 |
| Condensate | 3,429 | 19,815 | 577.9 |
| LPG(a) | 1,190 | 11,260 | 946.2 |
| Natural gas | 22,104 | 79,493 | 359.6 |
| Uranium | 1,631 | 3,165 | 194.1 |
| Total | 54,158 | 193,467 | 357.2 |
|
| (a) Naturally occurring. |
 |
| Source: Australian System of National Accounts, 2004-05 (5204.0). |
|
|
 Print Page