EMPLOYMENT AND VOLUNTARY WORK
CENSUS OF POPULATION AND HOUSING
The census offers a unique opportunity to obtain a wide range of data about sports and physical recreation employment. However, the employment figures obtained from the census for work in sports and physical recreation do not include second jobs, unpaid work, or persons usually working in a sports and physical recreation occupation but 'between jobs' during the week before Census night. Also, because some types of sports and physical recreation work (e.g. football umpiring) are seasonal in nature, some persons employed in sports and physical recreation occupations will not have been recorded as such during the census period.
Employment in sports and physical recreation occupations
Of all persons employed in the week prior to the 2001 Census, 83,008 (1.0%) had their main job in a sports and physical recreation occupation. For the 1996 Census the corresponding figure was 68,289 persons which was 0.9% of total employment. The increase in employment for sports and physical recreation occupations between 1996 and 2001 was 21.6%. In comparison, the increase for all occupations over the same period was 8.7%.
The sports and physical recreation occupations recording the largest numbers of persons employed in 2001 were Fitness instructors (12,364), Greenkeepers (11,928), Veterinarians (5,007), Veterinary nurses (4,858) and Recreation officers (3,842).
The majority of sports and physical recreation occupation groups showed some increase in employment between the 1996 and 2001 censuses, with nineteen of them increasing by more than 20%. The largest increases, in percentage terms, were for Outdoor adventure leaders (560.2% from 83 persons to 548 persons), Sail makers (84.3% from 235 to 433) and Fitness instructors (61.2% from 7,669 to 12,364). Fitness instructors also showed the largest growth in terms of the number of persons employed, with an increase of 4,695 persons during the period.
In comparison, there were seven sports and physical recreation occupation groups that experienced a decline in numbers between 1996 and 2001. In percentage terms, the largest falls occurred for Other sports centre managers (23.9% from 3,677 persons to 2,800 persons), Sports administrators (10.9% from 1,216 to 1,083) and Sports development officers (9.7% from 745 to 673).
In August 2001, there were more males (50,113 or 60.4%) than females (32,895 or 39.6%) employed in sports and physical recreation occupations. In comparison, of all employed persons in August 2001, 54.8% were male and 45.2% were female.
Persons employed in sports and physical recreation occupations showed a younger age profile relative to all employed persons. The 20-24 year age group had the largest number of persons employed in sports and physical recreation occupations ( 13,478 or 16.2%). There were considerably more younger workers employed in occupations such as Footballers, Sports umpires, Gymnastics coaches and Ticket collectors and ushers. By contrast, over forty percent of those employed as Horse or dog racing officials, or as Horse breeders, were aged 50 years or over.
7.1 EMPLOYMENT IN SPORTS AND PHYSICAL RECREATION OCCUPATIONS, By sex - 1996 and 2001 censuses |
|  |
 | 1996 CENSUS | 2001 CENSUS |  |
| Occupation | Males | Females | Persons | Males | Females | Persons |  |
|  |
| Environment, parks and land care manager | 1 889 | 447 | 2 336 | 1 823 | 509 | 2 332 |  |
| Sports administrator | 728 | 488 | 1 216 | 652 | 431 | 1 083 |  |
| Horse breeder | 653 | 476 | 1 129 | 688 | 541 | 1 229 |  |
| Park ranger | 1 438 | 257 | 1 695 | 1 255 | 351 | 1 606 |  |
| Natural and physical science professionals n.e.c. | 61 | 15 | 76 | 62 | 33 | 95 |  |
| Veterinarian | 2 779 | 1 467 | 4 246 | 2 975 | 2 032 | 5 007 |  |
| Recreation officer | 885 | 1 868 | 2 753 | 1 035 | 2 807 | 3 842 |  |
| Sport and recreation managers n.f.d. | 15 | 12 | 27 | 90 | 52 | 142 |  |
| Fitness centre manager | 486 | 417 | 903 | 626 | 537 | 1 163 |  |
| Other sports centre manager | 2 190 | 1 487 | 3 677 | 1 741 | 1 059 | 2 800 |  |
| Sport and recreation managers n.e.c. | 172 | 28 | 200 | 251 | 153 | 404 |  |
| Sportspersons, coaches and related support workers n.f.d. | 259 | 127 | 386 | 519 | 278 | 797 |  |
| Jockey | 705 | 169 | 874 | 813 | 311 | 1 124 |  |
| Golfer | 1 011 | 32 | 1 043 | 1 084 | 38 | 1 122 |  |
| Footballer | 986 | 5 | 991 | 1 377 | 8 | 1 385 |  |
| Other sportsperson | 1 441 | 450 | 1 891 | 1 965 | 826 | 2 791 |  |
| Gymnastics coach | 239 | 1 012 | 1 251 | 281 | 1 151 | 1 432 |  |
| Tennis coach | 1 044 | 312 | 1 356 | 1 419 | 358 | 1 777 |  |
| Swimming coach | 400 | 532 | 932 | 506 | 381 | 887 |  |
| Horseriding coach | 91 | 405 | 496 | 107 | 458 | 565 |  |
| Other sports coach | 1 727 | 800 | 2 527 | 1 991 | 887 | 2 878 |  |
| Sports development officer | 460 | 285 | 745 | 432 | 241 | 673 |  |
| Sports umpire | 1 403 | 558 | 1 961 | 1 840 | 698 | 2 538 |  |
| Horse or dog racing official | 351 | 32 | 383 | 365 | 45 | 410 |  |
| Other sports official | 60 | 19 | 79 | 89 | 35 | 124 |  |
| Gunsmith | 137 | 9 | 146 | 146 | 3 | 149 |  |
| Farrier(a) | 625 | 20 | 645 | 768 | 46 | 814 |  |
| Animal trainer(b) | 2 265 | 724 | 2 989 | 2 251 | 875 | 3 126 |  |
| Greenkeeper(c) | 11 609 | 300 | 11 909 | 11 637 | 291 | 11 928 |  |
| Canvas good maker | 282 | 286 | 568 | 354 | 257 | 611 |  |
| Sail maker | 214 | 21 | 235 | 398 | 35 | 433 |  |
| Apprentice leather goods, canvas goods or sail maker | 57 | 11 | 68 | 62 | 3 | 65 |  |
| Boat builder and repairer(d) | 2 166 | 47 | 2 213 | 3 153 | 60 | 3 213 |  |
| Veterinary nurse | 80 | 3 159 | 3 239 | 121 | 4 737 | 4 858 |  |
| Fitness instructor(e) | 2 234 | 5 435 | 7 669 | 3 685 | 8 679 | 12 364 |  |
| Outdoor adventure leader | 54 | 29 | 83 | 350 | 198 | 548 |  |
| Ticket collector or usher | 1 550 | 1 275 | 2 825 | 1 576 | 1 624 | 3 200 |  |
| Stud hand or stable hand | 1 171 | 1 356 | 2 527 | 1 626 | 1 867 | 3 493 |  |
| Total sports and physical recreation occupations | 43 917 | 24 372 | 68 289 | 50 113 | 32 895 | 83 008 |  |
| Total employment | 4 272 051 | 3 364 266 | 7 636 317 | 4 546 783 | 3 751 823 | 8 298 606 |  |
|  |
| (a) Comprises Farrier and Apprentice farrier. |
| (b) Comprises Animal trainers n.f.d., Horse trainer and Animal trainers n.e.c.. |
| (c) Comprises Greenkeepers n.f.d., Greenkeeper and Apprentice greenkeeper. |
| (d) Comprises Boat builder and repairer and Apprentice boat builder and repairer. |
| (e) Comprises Fitness instructors and related workers n.f.d. and Fitness instructor. |
| Source: Employment in Sport and Recreation, Australia, August 2001 (cat. no. 4148.0). |
Earnings and hours worked in sports and physical recreation occupations
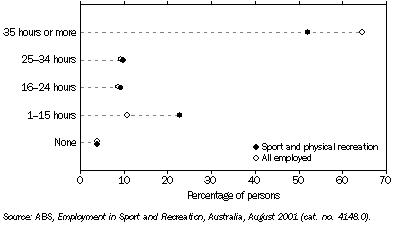
The census found that, compared to persons employed in all occupations, persons employed in sports and physical recreation occupations (as their main job) were more likely to be working part-time (i.e. less than 35 hours per week). Almost two thirds (64.6%) of persons employed in all occupations worked full-time (i.e 35 hours and over). By comparison, only 52.0% of persons employed in sports and physical recreation occupations worked full-time. Relatively large percentages of persons employed as Sports umpires (88.8%), Gymnastics coaches (84.9%), Ticket collectors or ushers (78.9%) and Fitness instructors (74.8%) worked part-time.
7.2 HOURS WORKED PROFILE OF OCCUPATIONS

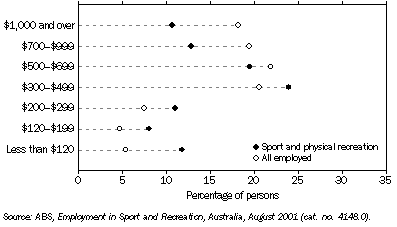
Persons employed in sports and physical recreation occupations as their main job received, on average, a lower income than persons employed in all occupations. The median weekly income for sports and physical recreation occupations was $453, compared with $587 for all occupations. This lower income may be related to the higher incidence of part-time employment in sports and physical recreation occupations.
Over two fifths (43.5%) of all persons employed in sports and physical recreation occupations received a gross weekly income between $300 and $700.
7.3 INCOME PROFILE OF OCCUPATIONS

 Print Page
 Print All