ATTENDANCE AT SELECTED CULTURAL VENUES AND EVENTS
The following paragraphs refer to results from the 2005-06 Multi-purpose Household Survey (MPHS) on attendance of people aged 15 years and over at selected cultural venues and events. State or territory data refer to respondent's state or territory of usual residence, rather than that of the venue or event. These data can not be compared with administrative data held by cultural venues on attendees, since details in relation to attendees under 15 years of age were not part of the survey. In addition, administrative data on attendees include multiple entrances while the MPHS provides data on how many times a respondent visited a cultural venue or event.
In the 12 months prior to interview in 2005-06, 90% of ACT residents aged 15 years and over attended at least one cultural venue or event. This was the highest attendance rate of any state or territory. During 2005-06, ACT usual residents also recorded the highest attendance rates for most of the selected cultural venues and events, with the exception of Zoological parks and aquariums, Other performing arts and Libraries.
ACT residents were more likely to have attended Cinemas than any other cultural venue or event, with 71% of the ACT population aged 15 years and over reporting reported that they had attended a Cinema at least once in the 12 months prior to the 2005-06 MPHS. The next most popular venue or event was Museums (with 47% of ACT residents aged 15 years and over attending at least once in the previous 12 months).
13.4 Attendance rate(a), Selected cultural venues and events - By state/territory(b) - 2005-06 |
|  |
 | NSW | Vic. | Qld | SA | WA | Tas. | NT | ACT | Aust. |  |
| Venue | % | % | % | % | % | % | % | % | % |  |
|  |
| Art galleries | 20.8 | 23.9 | 22.0 | 24.0 | 22.8 | 24.0 | 25.9 | 39.7 | 22.7 |  |
| Museums | 21.3 | 20.9 | 21.7 | 26.9 | 22.2 | 30.8 | 38.2 | 47.3 | 22.6 |  |
| Zoological parks and aquariums | 33.2 | 37.0 | 33.2 | 37.9 | 43.4 | 31.6 | 36.0 | 41.4 | 35.6 |  |
| Botanic gardens | 28.3 | 36.7 | 37.2 | 36.5 | 33.4 | 32.3 | 38.8 | 44.4 | 33.7 |  |
| Libraries | 31.9 | 33.2 | 35.1 | 40.3 | 36.7 | 35.6 | 28.1 | 34.9 | 34.1 |  |
| Classical music concerts | 9.7 | 9.3 | 8.2 | 9.7 | 10.8 | 9.3 | 7.9 | 13.3 | 9.4 |  |
| Popular music concerts | 23.9 | 23.6 | 25.8 | 26.2 | 30.8 | 24.1 | 29.5 | 34.1 | 25.2 |  |
| Theatre performances | 16.9 | 17.9 | 15.2 | 17.6 | 16.8 | 19.5 | 12.1 | 25.5 | 17.0 |  |
| Dance performances | 10.9 | 9.9 | 8.7 | 11.2 | 9.7 | 7.5 | 9.6 | 16.6 | 10.2 |  |
| Musicals and operas | 16.6 | 18.4 | 15.4 | 13.0 | 14.8 | 15.3 | 9.4 | 19.1 | 16.3 |  |
| Other performing arts | 15.3 | 16.7 | 16.4 | 20.5 | 17.6 | 16.9 | 14.8 | 19.7 | 16.6 |  |
| Cinemas | 62.9 | 67.1 | 66.8 | 64.0 | 66.6 | 56.4 | 68.2 | 71.3 | 65.2 |  |
| At least one venue or event | 82.9 | 84.9 | 86.3 | 85.1 | 87.6 | 81.5 | 89.2 | 89.8 | 84.8 |  |
|  |
| (a) Persons aged 15 years and over. |
| (b) Refers to the respondent's state or territory of usual residence. |
| Attendance at Selected Cultural Venues and Events, Australia, 2005-06 (cat. no. 4114.0) |
Attendance by sex
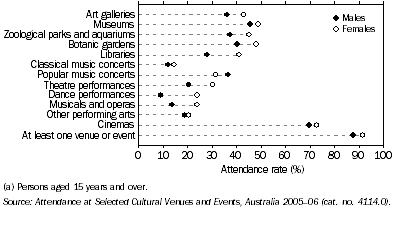
Other than for Popular music concerts, female ACT residents recorded higher attendance rates than males for all the cultural venues and events included in the 2005-06 MPHS. Overall, 92% of all female ACT residents, and 88% of male ACT residents aged 15 years and over attended at least one cultural venue or event in the previous 12 months.
13.5 Attendance at selected cultural venues and events (a), By sex
- ACT
- 2005-06

Attendance by age group
During 2005-06, all ACT residents aged 15-17 years were estimated to have attended at least one cultural venue or event (i.e. an attendance rate of 100%). The next highest attendance rates were recorded by ACT residents aged 18-24 years (95%).
Cinemas recorded the highest attendance rates for persons aged 15-74 years, both in the ACT and across other states and territories.