WASTE MANAGEMENT
The ACT Government initiated the 'No Waste by 2010' strategy in 1996 as its way of managing waste in the ACT. This strategy aims to utilise all unwanted material as a resource rather than sending it to landfill sites, and target prevention, reduction, reuse and recycling as ways of minimising waste.
The ACT Government operates three waste management sites within the ACT. Parkwood Road Recycling Estate at Macgregor is specifically for recyclable goods and does not accept garbage, while Mitchell Resource Management Centre and Mugga Lane Resource Management Centre accept both recyclables and garbage. The Hume Resource Recovery Estate is currently being developed in stages adjacent to the Mugga Lane Resource Management Centre. The Hume estate is to house recovery, reprocessing and resale of materials, lessening the number which end up in landfill. There are also a series of regional recycling centres.
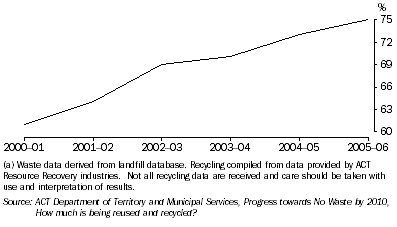
According to ACT Resource Recovery industries 75% of ACT waste was recovered while 25% went to landfill. This means that 192,313 tonnes of waste went to landfill in 2005-06. Recovery has increased every year for the last 6 years from 61% in 2000-01.
2.5 Resource recovery (a), ACT

The amount of paper resource recovered increased from 46,923 tonnes in 2004-05 to 54,576 tonnes in 2005-06. Demolition waste was the only waste type to decrease in the amount recovered from 2004-05 to 2005-06, from 241,956 tonnes to 221,836 tonnes. Building and demolition waste going to landfill also dropped from 29,737 tonnes to 22,320 tonnes.
2.6 Resource Recovery, ACT |
|  |
 | 2003-04 | 2004-05 | 2005-06 |  |
 | t | t | t |  |
|  |
| Paper | 42 624 | 46 923 | 54 576 |  |
| Glass | 6 872 | 10 195 | 12 087 |  |
| Plastic containers | 1 395 | 1 373 | 1 427 |  |
| Aluminium | 418 | 811 | 1 323 |  |
| Steel cans | 753 | 775 | 867 |  |
| Garden waste/compost | 181 639 | 197 748 | 208 606 |  |
| Demolition waste | 232 507 | 241 956 | 221 836 |  |
| Metals (ferrous) | 17 689 | 20 464 | 28 461 |  |
| Cooking oil & fat | 725 | 850 | 1 803 |  |
| Clothing | 4 580 | 4 238 | 4 455 |  |
| Motor Oil | 3 014 | 1 747 | 2 017 |  |
| Other | 12 224 | 27 856 | 41 980 |  |
| Total | 504 440 | 554 936 | 579 438 |  |
|  |
| ACT Department of Territory and Municipal Services, Progress towards No Waste by 2010, How much is being reused and recycled? |
Wastewater and sewage
Most of the wastewater and sewage generated in Canberra is treated at the Lower Molonglo Water Quality Control Centre (LMWQCC). The centre, which is the largest in inland Australia, typically processes between 80-100 million litres of wastewater every day. It currently serves a population of 310,000 persons. During Stage 3 Water Restrictions the LMWQCC also became a site where recycled water was made available on a restricted basis through arrangements with ACTEW.
The Fyshwick Sewage Treatment Plant partially treats some of the wastewater generated at Fyshwick and surrounding suburbs. After partial treatment, the wastewater is returned to the sewer for full treatment at the LMWQCC.
The LMWQCC is located on the Molonglo river, 1 km upstream from the junction with the Murrumbidgee River. After physical, chemical and biological treatment, the water is discharged into the Molonglo River.
Water quality in the river is extensively monitored and ecological monitoring such as the Fish Monitoring Program, plus counts of macroinvertebrates, provides information on the river's health. Platypus are often seen near where the treated water re-enters the Molonglo River.
Solid material removed from the sewage during treatment is incinerated at high temperatures. The 'agri-ash' which is created during this process is sold to farmers as a soil conditioner. Additionally, the LMWQCC uses treated effluent for irrigation for ovals and golf courses.
Between 2004-05 and 2005-06 the number of sewage customers increased by 2.2 percentage points from 130,355 to 133,217. Over the same period, the amount of sewage treated increased by 6.3 percentage points, from 27,293 ML to 29,019 ML. The amount of sewage treated per person per year increased by 5.4 percentage points, from 83.5 kL to 88 kL.
2.7 Selected Sewage Statistics, ACT |
|  |
 |  | 2001-02 | 2002-03 | 2003-04 | 2004-05 | 2005-06 |  |
|  |
| Customers | no. | 123 641 | 125 784 | 128 446 | 130 355 | 133 217 |  |
| Quantity of sewage treated | ML | 30 645 | 28 313 | 27 959 | 27 293 | 29 019 |  |
| Sewage treated per person per annum | kL | 97.6 | 89.2 | 86.6 | 83.5 | 88.0 |  |
| Length of mains | km | 2 875 | 2 897 | 2 921 | 2 948 | 2 985 |  |
|  |
| ACTEW Corporation Limited, 2005-06 Annual Report. |