POPULATION AND GROWTH
Estimated resident population
At 30 June 2006, the Australian Capital Territory (ACT) had an estimated resident population (ERP) of 334,200 persons, with 333,900 being in the Canberra Statistical Division. The Canberra-Queanbeyan Statistical District, with a population of 381,400 persons at June 2006 (1.8% of Australia's total population), is the eighth largest major population centre in Australia and larger than the capital cities of Hobart and Darwin.
5.1 Estimated resident population(a), Major population regions(b) - 30 June 2006 |
|  |
 | Population | Proportion of total Australian population |  |
 | no. | % |  |
Capital city statistical divisions |  |
|  |
| Sydney | 4 284 379 | 20.7 |  |
| Melbourne | 3 744 373 | 18.1 |  |
| Brisbane | 1 820 400 | 8.8 |  |
| Adelaide | 1 146 119 | 5.5 |  |
| Perth | 1 519 510 | 7.3 |  |
| Hobart | 205 566 | 1.0 |  |
| Darwin | 114 368 | 0.6 |  |
| Canberra | 333 940 | 1.6 |  |
Statistical Districts |  |
|  |
| Gold Coast-Tweed (QLD/NSW) | 565 256 | 2.7 |  |
| Newcastle (NSW) | 517 496 | 2.5 |  |
| Canberra-Queanbeyan (ACT/NSW) | 381 397 | 1.8 |  |
| Wollongong (NSW) | 227 972 | 1.1 |  |
| Sunshine Coast (QLD) | 224 127 | 1.1 |  |
| Geelong (VIC) | 167 802 | 0.8 |  |
| Townsville (QLD) | 152 954 | 0.7 |  |
| Cairns (QLD) | 131 564 | 0.6 |  |
| Toowoomba (QLD) | 121 894 | 0.6 |  |
| Launceston (TAS) | 103 325 | 0.5 |  |
| Albury-Wodonga (NSW/VIC) | 100 826 | 0.5 |  |
|  |
| (a) Estimates are preliminary rebased estimates and are based on the 2006 Census. |
| (b) Estimates are based on the 2006 Australian Standard Geographical Classification boundaries. |
| Australian Demographic Statistics, March quarter 2007 (cat. no. 3101.0). |
Population growth
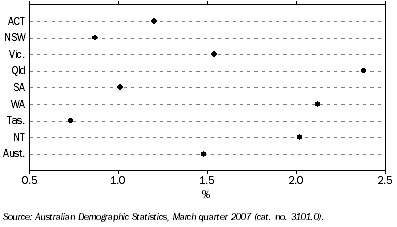
During 2005-06, the population of the ACT increased by nearly 4,000 people (from 330,300 at June 2005 to 334,200 at June 2006), equating to a population growth rate of 1.2%. This compares with a 2005-06 national growth rate of 1.5%.
Over the five years to June 2006, the average annual growth rate for the ACT was 0.9%, compared with an average annual growth rate of 1.3% at the national level.
5.2 Total population growth rate - 2005-06

Statistical Subdivision (SSD) population growth in the ACT
Between June 2001 and June 2006, more than half (55%) of all population growth in the ACT occurred in suburban fringe statistical subdivision (SSD) of Gungahlin-Hall, which increased by 8,200 people (equating to an average annual growth rate of 5.9%). However, population growth in this region has slowed compared with the five years to June 2001, when the average annual growth rate was 14.0%.
Smaller levels of population growth were recorded in the SSDs of North Canberra (up 5,200 people since June 2001), Belconnen (up 1,600 people), South Canberra (up 1,300 people) and Woden Valley (up 760 people).
The largest decrease in population between June 2001 and June 2006 occurred in the SSD of Tuggeranong, located in Canberra's south, down 1,200 people (or an average of 0.3% per year). The Weston Creek-Stromlo SSD recorded a smaller population decrease, down 780 people in the five years to June 2006.
Statistical Local Area (SLA) population growth in the ACT
Residential development in the new statistical local area (SLA) of Gungahlin has led to an increase of 3,900 people in the five years to June 2006. Dunlop, located in the north-western fringe of the Belconnen SSD, recorded the second largest population increase (up 3,200 people in the five years to June 2006). Amaroo, located in the north of the Gungahlin-Hall SSD, recorded the third largest population increase (up 2,300 people).
As at June 2006, the most populous SLAs within the ACT were Kambah (16,100 people), Ngunnawal (9,200 people) and Wanniassa (8,200 people). Since 2001, Gordon has replaced Kaleen as the fourth most populous SLA (with 8,100 people as at June 2006), while Kaleen is now the fifth most populous SLA (7,900 people at June 2006).
During the five years to June 2006, more than half of all SLAs in the ACT experienced population decreases. The three SLAs in the ACT with the largest decreases were all part of the Tuggeranong SSD. Kambah recorded the largest decrease (down 930 people), followed by Wanniassa (down 510 people) and Chisholm (down 390 people).