ECONOMIC IMPORTANCE OF TOURISM
INTRODUCTION
In October 2000 the ABS published Australian National Accounts: Tourism Satellite Account, 1997-98 (5249.0). This publication represents the first ABS attempt to put tourism into a national accounting framework.
Tourism is not a conventional industry in the System of National Accounts (SNA 93). It is defined by the customer (visitor) rather than the product produced. The tourism satellite account (TSA) creates a broad picture of tourism which allows it to be compared to conventional industries like agriculture, manufacturing and retail trade.
The estimates of tourism gross domestic product (TGDP) and tourism gross value added relate to the direct impact of tourism activity. This means that only the value added where there is a direct economic or physical relationship between the visitor and the producer of a good or service is included. Similarly, the employment estimates only include employment generated where visitors have a direct relationship with the producer of the good or service.
Key results
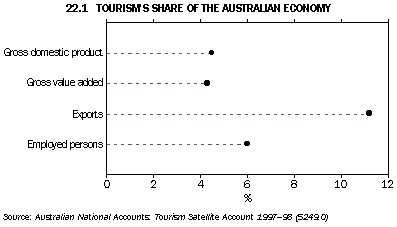
Tourism GDP measures the total market value of goods and services produced in Australia which are consumed by visitors, less the cost of the inputs used in producing those goods and services. Tourism accounted for $25.2b or 4.5% of Australia's GDP in 1997-98. Most of this was generated by domestic households (68% of tourism GDP), while international visitors and business/government visitors accounted for 21% and 11% of tourism GDP respectively.
Gross value added is the preferred national accounts measure of industry production as it excludes taxes and subsidies on products. In 1997-98, tourism gross value added was $22.4b. The air and water transport (14.5%), accommodation (10.7%), cafes, restaurants and takeaway food outlets (9.9%) and other retail trade industries (8.8%) accounted for 44% of total tourism gross value added. The remaining share was distributed widely among other industries.

22.5 TOURISM'S SHARE OF GROSS VALUE ADDED, Selected Countries
|
 | Share | Australia's ratio (1997-98)
adjusted to same
conceptual basis |
| Country | % | % |
|
| New Zealand (1997) | 4.7 | 4.0 |
| Canada (1997)(a) | 2.5 | 3.9 |
| USA (1997)(a) | 2.3-2.8 | 3.3 |
|
(a) Canadian and USA estimates are at factor cost i.e. taxes on production are excluded.
Source: ABS data available on request, Australian National Accounts: Tourism Satellite Account. |
22.6 TOURISM'S SHARE OF EMPLOYMENT, Selected Countries
|
 | Share | Australia (end June 1998)
adjusted to same
conceptual basis |
| Country | % | % |
|
| New Zealand (1997)(a) | 5.6 | 5.6 |
| Canada (1997) | 3.7 | 5.7 |
| USA (1997) | 3.3-4.0 | 5.1 |
|
(a) New Zealand estimates are for full-time equivalent employees.
Source: ABS data available on request, Australian National Accounts: Tourism Satellite Account. |
22.7 INTERNATIONAL VISITOR SHARE OF TOTAL TOURISM EXPENDITURE, Selected Countries
|
 | Share | Australia (1997-98)
adjusted to same
conceptual basis |
| Country | % | % |
|
| New Zealand (1997) | n.p. | 20 |
| Canada (1997) | 29 | 20 |
| USA (1997) | 19-22 | 22 |
|
| Source: ABS data available on request, Australian National Accounts: Tourism Satellite Account. |
Conclusion
The TSA expands the core national accounts to include tourism within the national accounting framework. The results show the importance of tourism to the Australian economy.
 Print Page