|
|
MEASURES OF SPREAD
Mean, median and mode give locations of a data set’s centre, but a data description will be more comprehensive if you also know the spread. (A basic numerical description of a data set requires a measure of both centre and spread.) Measures of spread include range, quartiles, mean and standard deviations, and variance.
RANGE
DEFINITION
Range is the actual spread of data, and hence includes any outliers. Thus, in any data set:
RANGE = DIFFERENCE BETWEEN HIGHEST AND LOWEST OBSERVED VALUES
The range can be expressed as an interval such as 4-10, where 4 is the lowest value and 10 is highest. Often it is expressed as interval width; that is, the range of 4-10 is 6. The latter convention will be used throughout this section.
The disadvantage of using range is that it does not measure the spread of the majority of values in a data set; rather, it measures spread between highest and lowest values. As a result, other measures are required to give a better picture of data spread.
QUARTILES
Quartiles, as the name suggests, divide data into four equal sets.
When observations are ordered in ascending order according to their value, the first or lower quartile, Q1 , is the value of the observation at or below which one-quarter (25%) of observations lie.
The second quartile, Q2 , is the median at or below which half (50%) of observations lie.
The third or upper quartile, Q3 , is the value of the observation at or below which three-quarters (75%) of the observations lie.
The median divides the data into two equal sets:
- the lower quartile is the value of the middle of the first set, and
- the upper quartile is the value of the middle of the second set.
INTERQUARTILE RANGE
The difference between upper and lower quartiles (Q3 - Q1) also indicates the spread of a data set. This is called the interquartile range. The interquartile range spans 50% of a data set, and eliminates the influence of outliers because, in effect, the highest and lowest quarters are removed. Thus:
INTERQUARTILE RANGE = DIFFERENCE BETWEEN UPPER AND LOWER QUARTILES
EXAMPLE
| 1. | A computer salesperson, X, sells the following number of computers in 12 months:
34, 47, 1, 15, 57, 24, 20, 11, 19, 50, 28, 37 |
| | Find the: | a) range | b) median |
|
 |  | c) upper and lower quartiles | d) interquartile range |  |
Answers.
|
| a) | Range = difference between the highest and lowest values
= 57 - 1
= 56 |
 | b) | Putting the values in order gives:
1, 11, 15, 19, 20, 24, 28, 34, 37, 47, 50, 57. |
 |  | Median = ( 12 + 1 ) ÷ 2 = 6.5th value
= (6th + 7th observations) ÷ 2
= (24 + 28) ÷ 2
= 52 ÷ 2
= 26 |
 | c) | Lower quartile = value of middle of 1st half of data.
Q1 = the median of 1, 11, 15, 19, 20, 24
= (3rd + 4th observations) ÷ 2
= (15+ 19) ÷ 2
= 52 ÷ 2
= 17
Upper quartile = value of middle of 2nd half of data
Q3 = the median of 28, 34, 37, 47, 50, 57
= (3rd + 4th observations) ÷ 2
= (37+47) ÷ 2
= 42 |
 | d) | Interquartile range = Q3 - Q1.
= 42-17
= 25 |
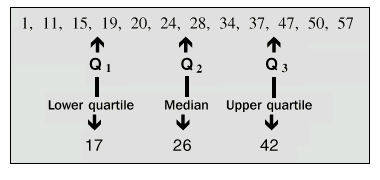
These results can be summarised as follows:

Note: This example has an even number of observations. The median, Q2, lies between the centre two observations (24 and 28), so the calculation of Q1 includes the observation 24 as it is below Q2 . Similarly, 28 is also included in the calculation of Q3 as it is above Q2.
Consider an odd number of observations such as l, 2, 3, 4, 5, 6, 7. Here the value of Q2 is 4. As the location of the median is right on the fourth observation, this value is not included in calculating Q1 and Q3 , as we are interested only in the data above and below Q2.
FIVE NUMBER SUMMARY
The median describes one location of a data set’s centre. The upper and lower quartiles span the middle half of a data set, and hence provide one measure of spread. The highest and lowest observations provide additional information about how far the data actually spread.
These values, when presented together and ordered from lowest to highest, are called a five number summary. So, from the previous example, the five number summary would be:
1, 17, 26, 42, 57
|
|
 Print Page
 Print All