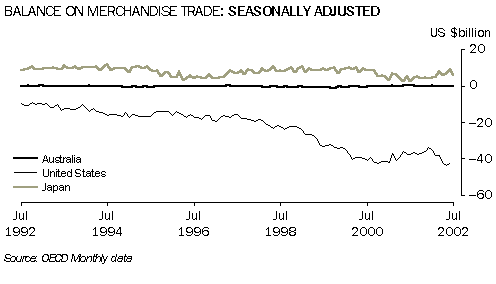
BALANCE ON MERCHANDISE TRADE(a)
|
| Period | United States
$USb | Japan
$USb | Germany
$USb | United Kingdom
$USb | Australia
$USb |
ANNUAL
|
| 1996-1997 | -206.3 | 66.2 | 67.4 | -23.4 | 0.0 |
| 1997-1998 | -232.5 | 99.7 | 71.3 | -34.2 | -1.8 |
| 1998-1999 | -300.6 | 108.1 | 70.3 | -49.8 | -7.3 |
| 1999-2000 | -429.3 | 110.7 | 65.7 | -50.8 | -7.7 |
| 2000-2001 | -478.9 | 72.1 | 62.9 | -54.6 | 0.3 |
| 2001-2002 | -458.0 | 66.4 | 101.8 | -52.8 | 0.5 |
MONTHLY (SEASONALLY ADJUSTED)
|
| 2000-2001 | | | | | |
| May | -36.1 | 2.3 | 7.4 | -4.5 | 0.4 |
| June | -37.4 | 5.3 | 5.8 | -5.2 | 0.4 |
| 2001-2002 | | | | | |
| July | -37.5 | 2.8 | 7.1 | -4.3 | 0.6 |
| August | -36.5 | 4.8 | 9.2 | -5.4 | 0.3 |
| September | -37.6 | 5.4 | 7.4 | -4.0 | 0.1 |
| October | -36.9 | 3.9 | 7.7 | -4.0 | 0.2 |
| November | -36.0 | 5.1 | 5.5 | -4.7 | -0.0 |
| December | -33.3 | 4.2 | 9.6 | -5.4 | -0.1 |
| January | -35.4 | 5.0 | 10.0 | -4.6 | 0.4 |
| February | -38.1 | 5.1 | 8.5 | -3.9 | -0.4 |
| March | -38.2 | 8.1 | 9.7 | -4.3 | -0.2 |
| April | -42.1 | 5.9 | 8.0 | -4.4 | 0.2 |
| May | -43.7 | 7.2 | 10.1 | -2.7 | -0.1 |
| June | -42.8 | 9.1 | 9.1 | -5.2 | -0.5 |
| 2002-2003 | | | | | |
| July | n.y.a. | 5.7 | 9.1 | n.y.a. | -0.3 |
(a) All series are exports (f.o.b.) less imports (c.i.f.), except the United States and Australia where imports are also f.o.b. Data are measured on a foreign trade basis. The OECD now publish this data in US billions. |
Source: Organisation for Economic Co-operation and Development (OECD) and Australian Bureau of Statistics (ABS). |
 Print Page
 Print Page