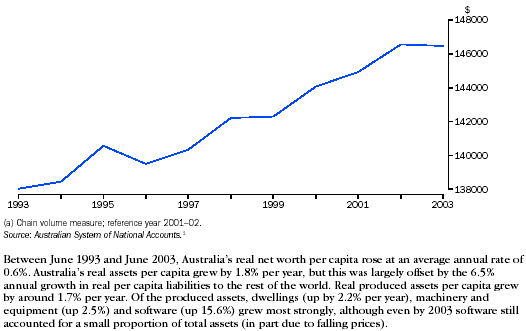
Real national net worth(a) per capita
| The relationship of national wealth to progress |  | National wealth and national income are very closely related. Along with the skills of the work force, a nation's wealth has a major effect on its capacity to generate income. Produced assets (such as machinery and equipment) are used in income-generating economic activity. Income, in turn, provides for saving that enables the accumulation of new wealth. |
| |
|  |
| About the headline indicator and its limitations: Real national net worth per capita |  | Real national net worth per capita - exhibits features that make it an informative indicator of national progress. It is a net measure - it shows the amount by which Australia's assets exceed its liabilities to the rest of the world. It is a per capita measure. Total wealth could rise if the population grew, even though there may have been no improvement in Australians' average wealth. And it is a real measure - it is adjusted to remove the effects of price change.
But it does not take account of everything that might be regarded as valuable. For example, it excludes: consumer durables (such as refrigerators) and motor vehicles that households use to produce services for themselves; native forests and other natural assets not used for economic production; valuables held as stores of wealth, such as precious metals and stones, antiques and works of art; human capital (e.g. knowledge and skills) and social capital (e.g. social networks and trust). |
| |
| |
| National wealth: Other indicators |  | Real national assets and liabilities per capita; Real net capital stock per capita; Real gross fixed capital formation per capita; Economically demonstrated resources (minerals and energy) per capita; Real net foreign debt; Average household net worth. |
| |
| |
| Some differences within Australia |  | Wealth statistics dissected by geography are not available but experimental studies of household wealth statistics dissected by age groups show, not surprisingly, that wealth increases as people have more time to accumulate it, i.e. as they age, although wealth also appears to be run down to some degree after retirement. |
| |
| |
| Links to other dimensions |  | The buildings and infrastructure used to deliver education, health and other services are important components of wealth, as are natural assets such as land and minerals. See also the commentaries National income, Financial hardship, Housing and The natural landscape. |
Progress and the headline indicator
National wealth and national income are very closely related.
Along with the skills of the work force, a nation's wealth has a major effect on its capacity to generate income. Produced assets (such as machinery and equipment) are used in income-generating economic activity. Some natural assets (such as minerals and native timber) generate income at the time of their extraction or harvest. Holdings of financial assets with the rest of the world (such as foreign shares, deposits and loans) return income flows to Australia. Other assets, such as owner-occupied dwellings, provide consumption services direct to their owners.
Income that is saved rather than spent on current consumption allows the accumulation of wealth that will generate income and support higher levels of consumption in the future.
There are many different indicators of wealth. The headline measure - real national net worth per capita - exhibits features that make it an informative indicator of national progress.
- It is a net measure - it shows the amount by which Australia's assets exceed its liabilities to the rest of the world.
- It is a per capita measure. Total wealth could rise if the population grew, even though there may have been no improvement in Australians' average wealth.
- It is a real measure - it is adjusted to remove the effects of price change. Nominal (or current price) wealth could rise during periods of asset-price inflation, even though there may have been no increase in the volume of tangible assets or no increase in capacity to generate future real income.
Estimating wealth
Estimates of assets and liabilities are shown in the national balance sheet which forms part of the Australian System of National Accounts. For an asset to appear in the balance sheet, some person or institution must be able to enforce ownership rights over it; also, it must be possible for the owner of the asset to derive economic benefit from holding or using it. Assets include:
- Dwellings, other buildings, machinery, inventories, plantation forests and so on ('produced non-financial assets').
- Land, native forests and minerals that are used for economic purposes ('non-produced non-financial assets').
- Currency, shares, loans and other securities ('financial assets').
Australia's liabilities to the rest of the world include borrowings from overseas and foreign holdings of Australian currency, shares and other securities.
In principle, all assets and liabilities appear in the balance sheet at market value; in practice, owing to data limitations, a variety of approximations and estimating procedures must be used.
The headline indicator includes a wide range of items, but it does not take account of everything that might be regarded as valuable. For example, it excludes:
- Consumer durables (such as refrigerators) and motor vehicles that households use to produce services for themselves.
- Native forests and other natural assets not used for economic production.
- Valuables held as stores of wealth, such as precious metals and stones, antiques and works of art.
- Human capital, the stock of knowledge and skills embodied in the Australian population.
Although these items are not built into the headline wealth measure, other commentaries (such as those for the Biodiversity, Marine ecosystems and Education and training dimensions of progress) provide information about some of them. |
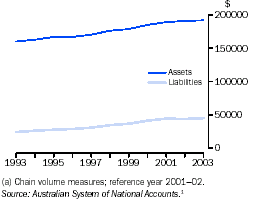
Real national assets and liabilities(a) per capita
Real national assets and liabilities per capita
Changes in Australia's net worth are the net result of changes in assets and liabilities. Between June 1993 and June 2003, Australia's real net worth per capita rose at an average annual rate of 0.6%. Australia's real assets per capita grew by 1.8% per year, but this was largely offset by the 6.5% annual growth in real per capita liabilities to the rest of the world. Nevertheless, in June 2003 the value of assets was more than four times that of liabilities.1
Between 1993 and 2003, real produced assets per capita grew by around 1.7% per year. Of the produced assets, dwellings showed fairly strong growth (up by more than 2% per year). Computer software grew by more than 15% a year, although even by 2003 software still accounted for a small proportion of total assets (in part due to falling prices).
Non-produced assets (such as land, mineral resources and native forests) are largely the result of natural endowment, although exploration and development have increased the economic value of these assets. Real non-produced assets per capita fell slightly (0.1% a year) between 1993 and 2003.
Australia's financial assets with the rest of the world more than doubled in real per capita terms between 1993 and 2003 (up by around 9.5% per year). Shares and other equity showed particularly strong growth. Australia's liabilities to the rest of the world rose by around 6.5% per year between 1993 and 2003. Again, shares and other equity showed strong growth.
What assets do Australians own?
The composition of Australia's total assets has been fairly stable during the past decade. There has been a modest decline in the relative importance of produced assets, and increases in the importance of non-produced and financial assets.
At 30 June 2003, significant assets included:
- land (28% of the total, down from 35% in 1993) and subsoil assets (no change at 6%)
- dwellings (19%, up marginally) and other buildings and structures (20%, down from 23%)
- machinery and equipment (9%), up marginally
- financial assets with the rest of the world (12%, up from 6%).
|
Major assets and liabilities(a) per capita
|
 | At 30 June
1993 | At 30 June
2003 | Average annual growth rate |
 |
 |  |  |  |
 | $ | $ | % |
|
| Produced assets | 86 573 | 102 115 | 1.7 |
| Non-produced assets | 66 327 | 65 875 |  |
 |  |  |  |
| Total non-financial assets | 152 119 | 167 996 | 1 |
| |  |  |  |
| Financial assets with ROW(b) | 9 566 | 23 690 | 9.5 |
| |  |  |  |
| Total assets | 160 151 | 191 686 | 1.8 |
 |  |  |  |
| Total liabilities to ROW(b) | 24 158 | 45 218 | 6.5 |
 |  |  |  |
| Net worth | 138 059 | 146 468 | 0.6 |
|
(a) In real/volume terms; reference year 2001-2002. Components may not sum to totals. (b) ROW = rest of the world.
Source: Australian System of National Accounts.1 |
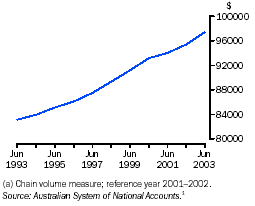
Real net capital stock(a) per capita
Assets used in production - produced capital
Machinery, buildings and some other fixed assets are inputs to the production of goods and services, and are an important repository of national wealth. Australia's stock of these assets has been growing for many years. Real net capital stock, the net present values of the future capital services to be provided by these assets, grew on average by 1.6% per year on a per capita basis between June 1993 and June 2003. In June 2003, fixed assets accounted for 47% of the total value of Australia's assets (down from 58% a decade earlier).1
The increase in capital stock has in turn led to an increase in the amount of capital services used per unit of labour input (a process known as 'capital deepening'). During the past decade, Australia's capital-labour ratio rose by almost 35% (or 3% per year). This has contributed to an increase in labour productivity.
The growth of a nation's net capital stock depends on the relative pace of two offsetting influences - investments (or 'capital formation') which increase the stock, and retirements and depreciation which reduce it. Investments significantly outstripped retirements and depreciation during the 1990s.
Real net capital stock(a) per capita
|
 | 30 June
1993 | 30 June
2003 | Average annual
growth rate |
 |
 | $ | $ | % |
|
| Dwellings | 29 899 | 36 998 | 2.2 |
| Other buildings and structures | 36 978 | 39 089 | 0.6 |
 |
| Machinery and equipment |  |  |  |
| | 14 088 | 18 046 | 2.5 |
| Software | 336 | 1 417 | 15.5 |
| Other assets | 2 311 | 1 887 | –2.0 |
 |  |  |  |
| All assets | 83 117 | 97 437 | 1.6 |
|
(a) Chain volume measures; reference year 2001-02. Components may not sum to totals.
Source: Australian System of National Accounts.1 |
Measuring Australia's capital stock
Broadly, economic statisticians have adopted two approaches to measuring a nation's stock of capital - direct measurement and the perpetual inventory method (PIM). Direct measurement involves surveying the owners of capital to ascertain the values of their machines, buildings and so on. Australian estimates are based on the PIM, which involves compiling a 'rolling inventory' of the capital stock based on historical data about investment flows. In a given year, investments in capital assets are added to the stock, and retirements of assets are deducted from the stock.
Several different measures of capital stock can be derived using the PIM. 'Net capital stock' is the most appropriate measure when one is analysing the nation's wealth. It has been adjusted downwards using estimates of depreciation as well as retirements. 'Productive capital stock' is the most appropriate measure when analysing production and productivity. |
Real net capital stock(a), by industry - June 1993 and June 2003
|
 | 30 June
1993 | 30 June
2003 | Average
growth
rate p.a. |
 |
 |
 | $million | $million | % |
|
| Agriculture, forestry and fishing | 57 379 | 54 860 | –0.4 |
| Mining | 88 885 | 132 845 | 4.1 |
| Manufacturing | 83 746 | 109 054 | 2.7 |
| Electricity, gas and water supply | 105 049 | 120 590 | 1.4 |
| Construction | 23 115 | 26 817 | 1.5 |
| Wholesale trade | 31 730 | 36 429 | 1.4 |
| Retail trade | 30 420 | 44 380 | 3.8 |
| Accommodation, cafes and restaurants | 27 601 | 39 055 | 3.5 |
| Transport and storage | 141 542 | 166 920 | 2 |
| Communication services | 40 223 | 68 900 | 5.5 |
| Finance and insurance | 58 419 | 68 058 | 1.5 |
| Property and business services | 64 044 | 96 438 | 4.2 |
| Government admin and defence | 57 405 | 60 614 | 0.5 |
| Education | 63 020 | 76 874 | 2 |
| Health & community services | 43 601 | 60 246 | 3.3 |
| Cultural and recreational services | 10 333 | 20 819 | 7.3 |
| Personal and other services | 12 997 | 18 713 | 3.7 |
| Ownership of dwellings | 528 227 | 735 576 | 3.4 |
 |  |  |  |
| All industries | 1 468 436 | 1 937 187 | 2.8 |
|
(a) Chain volume measures; reference year 2001-02. Components may not sum to totals.
Source: Australian System of National Accounts.1 |
Diverse trends may underlie the aggregate growth pattern, such as shifts in the composition of economic activity toward industries that are more or less capital intensive, or more or less rapid capital deepening in individual industries. Technological changes - for example, the recent rapidly increasing importance of computer and communications hardware and software - have been a major driver of such trends.
Between 1993 and 2003, the types of capital showing the most rapid growth were dwellings (up 2.2% per year), machinery and equipment (up 2.5% per year) and software (up 15.5% per year).
Between 1993 and 2003, the industries showing the most rapid growth in net capital stock were Cultural and recreational services (up 7.3% per year), Communication services (up 5.5% per year) and Property and business services (up 4.2% per year).
Capital formation
Capital formation (commonly termed 'investment') is the process of creating produced assets - such as machinery and buildings - that can be used for production of goods and services. Capital formation is a key influence on Australia's capacity to generate income in the future.
Gross fixed capital formation is the value of acquisitions less disposals of new or existing fixed assets. The measure is 'gross' because it has not been adjusted for depreciation (the consumption of fixed assets during the production process). (See box.)
Australia experienced a recession in the late 1980s and early 1990s. During this period capital formation fell. However, it recovered in 1992-93 and continued to increase through the remainder of the decade. Between 1992-93 and 2002-03 it rose by 5.6% per year on average.
Capital formation is undertaken by all domestic sectors: general government, public corporations and the private sector, which comprises private corporations and the household sector. The private sector consistently contributed most to overall capital formation during the past decade.
Gross versus net capital formation
The indicator here is capital formation gross of depreciation (called 'consumption of fixed capital' in the Australian System of National Accounts).
During the years 1992-93 to 2002-03 depreciation was equivalent to around 65%-76% of gross capital formation.
A gross-of-depreciation measure is most suitable when one is analysing investment as a component of aggregate expenditure; a net measure is most suitable when one is analysing increases in the total stock of capital. |
Real gross fixed capital formation(a) per capita

| Real gross fixed capital formation(a) per capita, by sector

|
After an initial decrease in the early 1990s, private sector investment recovered and grew by 87% from 1992-93 to 2002-03. The private sector's contribution to overall gross fixed capital formation rose from around 78% in 1992-93 to just under 85% in 2002-03. Government and public corporations made a smaller contribution to total real gross fixed capital formation per capita. Government investment accounted for about 9% of the total investment figure in 2002-03, while public corporations accounted for about 6%.
Within private gross capital formation, there was strong growth during the decade in investment in dwellings (up 48% in real per capita terms between 1992-93 and 2002-03). Investment in machinery and equipment also grew appreciably. By 2002-03, machinery and equipment accounted for about 37% of total private capital formation, compared to 30% a decade earlier. Purchases of information technology (including computer hardware and software) are among the fastest growing components, although it still accounts for only a small proportion of total capital formation, in part due to falling prices.
Private real gross fixed capital formation per capita(a), by type of asset
|
 |
1992-93 |
2002-03
| Average
annual
change |
 |
 |
 | $ | $ | % |
|
| Dwellings | 1 559 | 2 304 | 4.0 |
| Other buildings & structures | 779 | 1 358 | 5.7 |
| Machinery & equipment | 1 262 | 2 867 | 8.5 |
| Livestock | 140 | 74 | –6.2 |
| Intangible fixed assets | 190 | 613 | 12.4 |
| Ownership transfer costs | 482 | 629 | 2.7 |
| Total | 4 197 | 7 845 | 6.5 |
|
(a) Chain volume measures; reference year 2001-02. Components may not sum to totals.
Source: Australian System of National Accounts.1 |
Non-produced assets - mineral and energy resources
Australia has many types of natural assets. Air, water, soil, and biodiversity resources are discussed in other commentaries. Subsoil assets, discussed below, are of major economic significance.
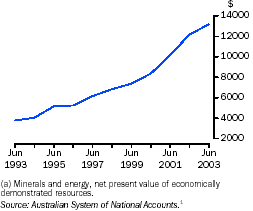
In recent years, there has been continued growth in Australia's known mineral resources, or economically demonstrated resources (EDR) (see box). The net present value of Australia's EDR per capita grew on average by around 13.3% a year between June 1993 and June 2003. After adjusting for the effects of price change, the real per capita value of Australia's subsoil assets grew by a little over 2.3% per year on average over the same period.
Economically demonstrated resources(a) per capita
Measuring Australia's mineral and energy resources
Estimating a nation's subsoil assets (such as coal, iron ore and so on) is a complex task. The size and value of such assets can be affected by technological change (which impinges on both exploration and extraction activities), by changes in prices (which can affect whether extraction is economically worthwhile) and by other influences.
The ABS uses the Bureau of Resource Sciences' term' economically demonstrated resources' (EDR) to embody these concepts. EDR refers to subsoil assets ‘with a very high degree of geological assurance and for which extraction is expected to be profitable over the life of the mine’.
Estimating the value of EDR requires a complex calculation of the present value of the income stream likely to flow from the asset. That income stream in turn depends on information about such factors as the value of annual output, production costs, and the expected life of the mine. Changes in EDR must be interpreted with care. For some resources, mining companies search for and ‘prove’ (confirm the physical extent and value of) just enough mineral deposit to support a certain number of years of future extraction. |
The growth of a nation's stock of subsoil assets broadly depends on the relative pace of two offsetting influences - discoveries which increase the stock, and extractions which reduce it. The former significantly outstripped the latter during the 1990s, as was the case for most of the twentieth century. But because the value of subsoil assets is defined in terms of EDR (see box), other influences come into play. There might, for example, be a marked rise in the world price for a mineral or a technological innovation that makes it economic to extract a known deposit that was hitherto uneconomic.
In 2003, Australia had the world's largest demonstrated resources of lead, certain mineral sands (alluvial ilmenite, rutile and zircon), tantalum, uranium, silver and zinc. And Australia ranked among the top six countries for many other minerals such as black and brown coal, bauxite, copper, cobalt, diamonds, gold, iron ore, manganese ore and nickel.1
Among the minerals showing strongest annual growth in net present value of EDR in current price terms between 1993 and 2003 were naturally occurring LPG (up 24.7%), black coal (up 21.6%) and iron ore (up 19.8%).
Economically demonstrated resources(a) per capita, by mineral - June 1993 and June 2003
|
 | 30 June
1993 | 30 June
2003 | Average
annual
growth rate |
 | $/cap | $/cap | % |
|
| Bauxite | 139 | 266 | 6.7 |
| Black coal | 462 | 3 258 | 21.6 |
| Copper | 126 | 577 | 16.4 |
| Iron ore | 126 | 769 | 19.8 |
| Magnesite | 37 | 100 | 10.5 |
| Mineral sands | 102 | 245 | 9.1 |
| Nickel | 199 | 938 | 16.8 |
| Petroleum - crude oil | 886 | 1 566 | 5.8 |
| Petroleum - natural gas | 1 053 | 3 386 | 12.4 |
| Petroleum - condensate | 181 | 841 | 16.6 |
| LPG naturally occurring | 52 | 468 | 24.7 |
| Uranium | 111 | 177 | 4.7 |
| Zinc | 135 | 330 | 9.4 |
| Other minerals | 177 | 284 | 4.9 |
 |  |  |  |
| All minerals | 3 785 | 13 195 | 13.3 |
|
(a) Minerals and energy, net present value of economically demonstrated resources.
Source: Australian System of National Accounts.1 |
External liabilities - foreign debt
In recent years, Australia's debt to the rest of the world has increased. Real net foreign debt grew on average by 5.4% per year between June 1993 and June 2003.2
The growth in a country's foreign debt can reflect several related influences. The value of its imports and other current payments to foreigners may outstrip the value of its exports and other current receipts from foreigners - if so, the nation experiences a deficit on its current account which must be funded.
An alternative view is that the saving of a country's residents may be outstripped by its needs for investment - i.e. the country experiences a shortfall in saving. Current account deficits and saving shortfalls are conceptually the same phenomenon; they may be financed by, say, selling equity in enterprises to residents of other countries, or by borrowing from residents of other countries, or by running down financial assets held abroad.
Real net foreign debt(a) - June 1993 to June 2003
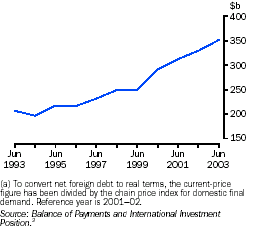
Real net foreign debt(a), by sector - June 1993 and June 2003
|
 | 30 June
1993 | 30 June
2003 | Average
annual
growth rate |
 |
 |
 | $b | $b | % |
|
| General government | 24.1 | 13.0 | –6.0 |
| Other public sector | 44.2 | –4.1 | . . |
| Private financial corporations | 64.9 | 279.2 | 15.7 |
| Private non-financial corporations | 73.9 | 63.6 | –1.5 |
 |  |  |  |
| Australia | 207.1 | 351.7 | 5.4 |
|
(a) To convert net foreign debt to real terms, the current-price figure has been divided by the chain price index for domestic final demand. Reference year is 2001–02.
Source: Balance of Payments and International Investment Position.2 |
Foreign holdings of Australian equity and debt were both rising through much of the twentieth century.2 Australia must pay income (dividends or interest) on both forms of liability to foreign residents. However, if by incurring those liabilities Australia has been able to acquire capital or other assets that enhance its productive capacity and income-generating potential, then the increased liabilities may not, on balance, have a deleterious impact on progress.
The public sector and private sector components of foreign debt showed markedly different trends during the past decade.
The real net foreign debt of the public sector rose from $68.3b in June 1993 to a peak of $79.5b in June 1995. Thereafter, it fell to just under $9.0b in June 2003.
Australia's net foreign debt
Australia's net foreign debt is the net outcome of:
- Australian borrowing from overseas ($568b in current-price terms at 30 June 2003).
- Foreign borrowing from Australia ($210b in current-price terms at 30 June 2003).
Debt liabilities can be held by the public sector (for example, Commonwealth, state and local government, the Reserve Bank and other public sector corporations) and the private sector (for example, private financial and non-financial corporations).
Australia's capacity to service its foreign debt
Australia must pay interest on its foreign debt. The debt servicing ratio is a commonly used measure of a country's capacity to pay the costs associated with debt. It is calculated by dividing export earnings (goods and services credits) into the interest payments (income payable on net foreign debt). During the past decade, Australia's debt service ratio has improved from 12.2% in 1992-93 to 8.3% in 2002-03. |
The real net foreign debt of the private sector, after having been fairly steady at around $130-140b in the first half of the 1990s, rose throughout the second half of the decade to reach $342.8b in June 2003.
Some differences within Australia
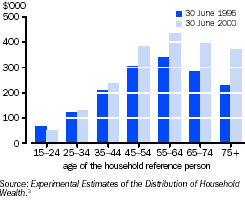
Wealth statistics dissected by geography are not available but experimental studies of household wealth statistics dissected by age groups show, not surprisingly, that wealth in nominal terms increases as people have more time to accumulate it, that is as they age, although wealth also appears to be run down to some degree after retirement. Average wealth is distributed quite differently from income, which falls away sharply for the age groups in which more people have retired.
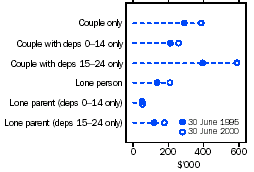
The distribution of wealth also varies across household types. Two main conclusions can be drawn. First, younger households (whether lone person, younger group households or those with younger children) have lower average wealth than older households. Second, households containing couples appear to accumulate wealth more readily than lone person or lone parent households, which may reflect couples' having access to two incomes for extended periods.
Between 1995 and 2000, couple households with children had higher average net worth than lone parent households with children of a similar age. Couples with dependent students aged 15-24 had the highest average net worth in all periods. This is likely to reflect the effects of couple formation, and the accumulation of wealth in older age groups.
The net worth of different types of households is closely associated with their average dwelling and superannuation assets. Average wealth appeared to rise between 1995 and 2000 for all age groups, but the rise was most marked where the household reference person was 45 or older, for whom growth appears to have been particularly strong in dwellings assets, superannuation and shares.
Average household net worth, by age
| Average household net worth, selected household types
|
Average household owner-occupied dwelling assets
|
 | 1996 | 2000 |
 |  |  |
Age of household
reference person | $‘000 | $‘000 |
 |
|
| 15-24 | 25 | 26 |
| 25-34 | 72 | 93 |
| 35-44 | 121 | 156 |
| 45-54 | 143 | 182 |
| 55-64 | 143 | 184 |
| 65-74 | 124 | 179 |
| 75+ | 122 | 166 |
|
| Source: Experimental Estimates of the Distribution of Household Wealth.3 |
Average household superannuation assets
|
 | 1996 | 2000 |
 |  |  |
Age of household
reference person | $‘000 | $‘000 |
 |
|
| 15-24 | 11 | 21 |
| 25-34 | 15 | 32 |
| 35-44 | 32 | 65 |
| 45-54 | 93 | 130 |
| 55-64 | 98 | 133 |
| 65-74 | 50 | 64 |
| 75+ | 20 | 31 |
|
| Source: Experimental Estimates of the Distribution of Household Wealth.3 |
 |  |  |
Factors influencing change
The growth in a nation's wealth is the outcome of a wide variety of influences. Broadly, changes in real wealth reflect both accumulations of past saving or dissaving and changes in the prices of assets and liabilities.
The economic cycle has a significant impact on the investment activity of a nation, which in turn, can affect its population's ability to accumulate wealth. The Australian economy's strong growth following the recession in the early part of the 1990s underpinned the increase in gross fixed capital formation in the 1990s.
Changes in technology, especially in information technology, have also influenced the increase in investment activity. For example, the computerisation of many manufacturing systems and processes may have driven increases in investment in machinery and equipment.
Links to other dimensions of progress
The connections between wealth and income are discussed above and in the income commentary, and the link between wealth and financial hardship is discussed in that commentary.
The buildings and infrastructure used to deliver education, health and other services are important components of wealth, as are natural assets such as land and minerals.
See also the commentaries National income, Productivity, Financial hardship and The natural landscape.
Endnotes
1. Unless otherwise indicated, all data in this commentary are derived from Australian Bureau of Statistics, 2003, Australian System of National Accounts 2002-03,
cat. no. 5204.0, ABS, Canberra.
2. All data in this segment is derived from Australian Bureau of Statistics 2003, Balance of Payments and International Investment Position, Australia, cat. no. 5302.0, ABS, Canberra.
3. Working papers in Econometrics and Applied Statistics, Australian Bureau of Statistics September 2002, Experimental Estimates of the Distribution of Household Wealth, Australia, 1994-2000, cat. no. 1351.0, ABS, Canberra.
 Print Page
 Print All