HEALTH STATUS
Morbidity
The 2004-05 NHS found almost 77% of the Australian population reported one or more long-term conditions (i.e. conditions that have lasted, or are expected to last for six months or more). In most cases, respondents were asked about conditions which had been medically diagnosed.
Among adults aged 18 years and over in 2004-05, women in general were more likely than men to report selected long-term conditions with the exception of total/partial hearing loss, back problems and diabetes (table 11.2). Women were also more likely to consult health professionals. For example, in 2004-05 it was estimated 26% of women had consulted a doctor in the two weeks prior to the survey interview, compared with 20% of men. Women also have a longer life expectancy at birth, 83.3 years compared with 78.5 for men (based on statistics for the period 2003-05). This results in higher proportions of women in the older age groups where long-term conditions are common.
11.2 SELECTED LONG-TERM CONDITIONS(a)(b) - 2004-05 |
|  |
 | Males | Females | Persons |  |
 | % | % | % |  |
|  |
| Long sightedness | 31.1 | 37.2 | 34.2 |  |
| Short sightedness | 24.3 | 30.8 | 27.6 |  |
| Arthritis | 17.1 | 23.0 | 20.1 |  |
| Back problems(c) | 21.1 | 18.7 | 19.9 |  |
| Hayfever and allergic rhinitis | 16.7 | 20.1 | 18.4 |  |
| Hypertension | 13.5 | 14.5 | 14.0 |  |
| Total/partial hearing loss | 17.2 | 8.9 | 13.0 |  |
| Asthma | 7.8 | 11.8 | 9.8 |  |
| Diabetes mellitus | 5.2 | 4.0 | 4.6 |  |
|  |
| (a) Conditions which have lasted or are expected to last six months or more. |
| (b) Persons aged 18 years and over. |
| (c) Includes back pain, back problems n.e.c. and disc disorders. |
| Source: ABS data available on request, National Health Survey. |
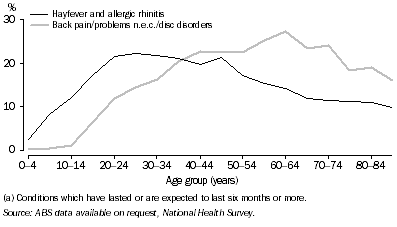
The proportion of people who reported back pain, back problems and disc disorders increased rapidly after early teenage years from 1% among those aged 10-14 years, to 23% among people aged 40-44 years. Prevalence then tended to decrease among those aged 65 years and over (graph 11.3).
The proportion of people reporting hayfever and allergic rhinitis as long-term conditions rose steadily in young people, and was highest among those aged 25-34 years, at 22%. Prevalence then generally decreased in the older age groups, to around 11% among those aged 70 years and over.
11.3 Selected long-term conditions(a), by age
- 2004-05

Mortality
There were 130,700 deaths registered in 2005, consisting of 67,200 males and 63,500 females. The age-standardised death rate of 598 deaths per 100,000 population in 2005 was 23% lower than the corresponding rate of 778 in 1995. This is consistent with continuing improvements in life expectancy in Australia (see the
Population chapter).
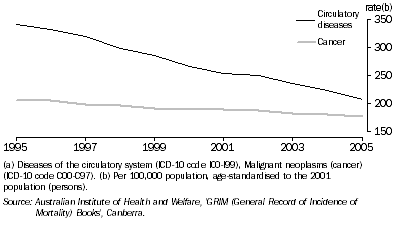
Cancer and diseases of the circulatory system (also called cardiovascular disease) together account for two-thirds of all deaths. Over the ten years to 2005, death rates from cancer and diseases of the circulatory system have both declined, though the decline has been more substantial in death rates from diseases of the circulatory system. From 1995 to 2005, the standardised death rate for malignant neoplasms (cancer) decreased by 14%, while the rate for diseases of the circulatory system decreased by 39% (graph 11.4).
11.4 Death rates from circulatory diseases and cancer(a)

Causes of death
Ischaemic heart diseases (heart attack and related disorders) are the leading causes of death for both males and females (table 11.5). Gender differences are apparent among other leading causes. Lung cancer is ranked second for males followed by cerebrovascular diseases (stroke) and chronic lower respiratory diseases; while for females, cerebrovascular diseases (stroke) is second, dementia and Alzheimer's disease is third and breast cancer fourth.
Notable differences are apparent in the rankings for certain specific causes between males and females. In males, for example, suicide is a prominent cause of death (ranked ninth) accounting for 1,657 male deaths, while this cause for females is outside the leading ten causes, accounting for 444 female deaths in 2005.
11.5 LEADING CAUSES OF DEATH - 2005 |
|  |
| Rank(b) | Underlying cause of death | ICD-10 code | rate(a) |  |
MALES |  |
|  |
| 1 | Ischaemic heart diseases | I20-I25 | 123 |  |
| 2 | Lung cancer | C33,C34 | 46 |  |
| 3 | Cerebrovascular diseases | I60-I69 | 46 |  |
| 4 | Chronic lower respiratory diseases | J40-J47 | 30 |  |
| 5 | Prostate cancer | C61 | 29 |  |
| 6 | Colorectal cancer | C18-C21 | 23 |  |
| 7 | (c)Cancers of lymphoid, haematopoietic and related tissue | C81-C96 | 20 |  |
| 8 | Diabetes | E10-E14 | 18 |  |
| 9 | Suicide | X60-X84 | 16 |  |
| 10 | Dementia and Alzheimer's disease | F01, F03, G30 | 14 |  |
| All causes |  | | 664 |  |
FEMALES |  |
|  |
| 1 | Ischaemic heart diseases | I20-I25 | 109 |  |
| 2 | Cerebrovascular diseases | I60-I69 | 67 |  |
| 3 | Dementia and Alzheimer's disease | F01, F03, G30 | 32 |  |
| 4 | Breast cancer | C50 | 27 |  |
| 5 | Lung cancer | C33,C34 | 26 |  |
| 6 | Chronic lower respiratory diseases | J40-J47 | 24 |  |
| 7 | Colorectal cancer | C18-C21 | 18 |  |
| 8 | Diabetes | E10-E14 | 17 |  |
| 9 | Influenza and pneumonia | J10-J18 | 17 |  |
| 10 | Diseases of the urinary system | N00-N39 | 17 |  |
| All causes | | | 621 |  |
|  |
| (a) Rate per 100,000. |
| (b) Using ranking list for leading causes of death published in 'Bulletin of the World Health Organisation, April 2006'. |
| (c) Includes leukaemias, lymphomas and other causes. |
| Source: ABS data available on request, Causes of Death collection. |
International comparisons
Australia's death rates from all causes are among the lowest in the world, consistent with Australia's relatively high life expectancy. Age-standardised death rates for males and females in selected countries are shown in table 11.6.
11.6 AGE-STANDARDISED DEATH RATES(a), By selected countries |
|  |
 | Year(b) | Males(c) | Females(d) |  |
|  |
| Australia(e) | 2005 | 393 | 253 |  |
| Canada | 2000 | 481 | 316 |  |
| Czech Republic | 2002 | 709 | 412 |  |
| Denmark | 1999 | 615 | 435 |  |
| Finland | 2002 | 559 | 324 |  |
| France | 2000 | 543 | 300 |  |
| Germany | 2001 | 541 | 337 |  |
| Greece | 2001 | 497 | 308 |  |
| Hungary | 2002 | 919 | 487 |  |
| Ireland | 2001 | 587 | 380 |  |
| Italy | 2001 | 479 | 289 |  |
| Japan | 2002 | 416 | 225 |  |
| Korea, Republic of (South) | 2002 | 619 | 340 |  |
| Netherlands | 2003 | 508 | 349 |  |
| New Zealand | 2000 | 502 | 336 |  |
| Norway | 2001 | 511 | 332 |  |
| Poland | 2002 | 788 | 406 |  |
| Portugal | 2002 | 605 | 348 |  |
| Slovakia | 2000 | 874 | 458 |  |
| Spain | 2001 | 506 | 279 |  |
| Sweden | 2001 | 461 | 320 |  |
| Switzerland | 2000 | 476 | 302 |  |
| United Kingdom | 2002 | 521 | 368 |  |
| United States of America | 2000 | 584 | 399 |  |
|  |
| (a) Age standardised using the World Health Organisation standard population. |
| (b) Latest available year. |
| (c) Rate per 100,000 males. |
| (d) Rate per 100,000 females. |
| (e) Age-standardised death rates in 2001 were 438 male deaths per 100,000 males and 287 female deaths per 100,000 females. |
| Source: Australian Institute of Health and Welfare, 'GRIM (General Record of Incidence of Mortality) Books', Canberra; WHO 2005. |
Infant mortality
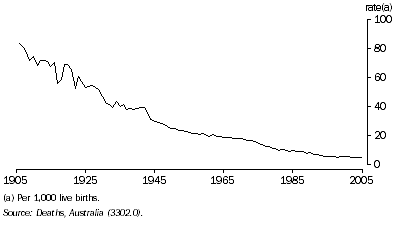
In 2005, 1,300 infant deaths were registered in Australia. The infant mortality rate (IMR) is defined as the number of deaths of children under one year of age per 1,000 live births. The infant mortality rate of 5.0 infant deaths per 1,000 live births in 2005 was higher than the 2004 rate (4.7), 12% lower than the IMR in 1995 (5.7 deaths per 1,000 live births), and 49% lower than that recorded in 1985 (11.9 deaths per 1,000 live births). Australia's infant mortality has declined significantly in the last 100 years. In 1905, around one in 12 infants did not survive to their first birthday (IMR of 81.8 in 1905); in 2005, only one in 200 infants born did not survive their first year of life (IMR of 5.0) (graph 11.7).
11.7 Infant mortality rate

The decline in infant mortality in the early-20th century has been linked to improvements in public sanitation and health education. Later declines may be a consequence of the introduction of universal health insurance (Medicare) and improvements in medical technology, such as neonatal intensive care units.
 Print Page