AGRICULTURE INDUSTRY
At 30 June 2006 there were about 155,000 businesses with an estimated value of agricultural operations of $5,000 or more. For the vast majority of these, their primary activity was agriculture, as defined in the Australian and New Zealand Standard Industrial Classification (ANZSIC), 2006 (1292.0). While the remainder were undertaking some form of agricultural activity, their main activity was not in agriculture. The majority of agricultural businesses were mainly engaged in either beef cattle farming, mixed grain/sheep/beef farming, sheep farming, grain growing, or dairy cattle farming.
Gross value of agricultural commodities produced
The contribution of agriculture to the Australian economy can be measured in a number of ways. The most direct measurement available is the gross value of agricultural production. For the year ending 30 June 2006, the gross value of agricultural production, in current prices, was $37.3 billion (b). On a commodity basis, cattle and calves slaughterings contributed most to the gross value of production ($7.7b) followed by wheat ($5.1b), milk ($3.3b), fruit - excluding grapes, ($2.5b) and vegetables ($2.3b). Sheep and lamb slaughterings, and wool production were both valued at $2.1b.
Employment
The agriculture sector is an important source of employment in regional and rural Australia. The number of people employed in the Agriculture and Services to agriculture industries increased marginally in 2007 to a yearly average of 334,000 persons, the first increase for five years (table 16.3). A 15% reduction in the work force in 2003 was largely the result of the drought experienced over most of Australia in that year which severely affected the agriculture sector. Since then, much of Australia has barely been out of drought, with employment in the agriculture sector averaging 338,000 people over the last five years - still 18% less than those employed in 2002. The majority of people employed in agriculture in 2007 were men (68%).
16.3 AGRICULTURE AND SERVICES TO AGRICULTURE INDUSTRIES, Employment(a)(b) |
|  |
 | Males | Females | Persons |  |
 | '000 | '000 | '000 |  |
|  |
| 2003 | 237.9 | 109.3 | 347.2 |  |
| 2004 | 235.3 | 109.2 | 344.4 |  |
| 2005 | 225.6 | 109.0 | 334.6 |  |
| 2006 | 223.6 | 106.1 | 329.7 |  |
| 2007 | 227.0 | 107.1 | 334.0 |  |
|  |
| (a) Employed persons include persons who worked without pay for at least one hour per week in a family business or on a farm (i.e. unpaid family helpers). Persons who worked in another industry and in agriculture are classified to the industry of predominant activity, according to the Australian and New Zealand Standard Industrial Classification (ANZSIC), 1993 edition. |
| (b) Annual average of quarterly data. |
| Source: Labour Force, Australia, Detailed, Quarterly (6291.0.55.003). |
Selected financial performance measures
Statistics of the financial performance of farm businesses provided in this section are based on information collected in the annual Australian Agricultural and Grazing Industries Survey, conducted by the Australian Bureau of Agricultural and Resource Economics (ABARE). This collection covers farm businesses engaged in the 'broadacre' Grain, sheep and beef cattle farming industry, as defined in ANZSIC.
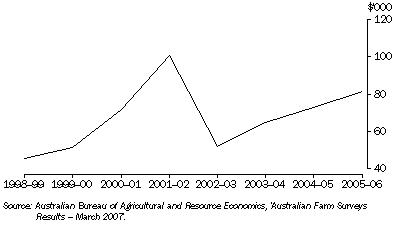
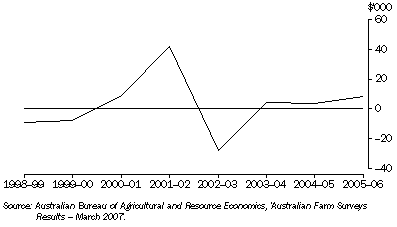
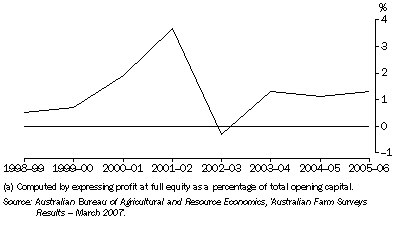
Selected financial performance measures - expressed as annual averages per farm - for all broadacre farm businesses for the years 2001-02 to 2005-06 are shown in table 16.4 and for the years 1998-99 to 2005-06 in graphs 16.5, 16.6 and 16.7. They show how the financial performance of Australian farms continued to improve in 2005-06 as the impact of the widespread drought of 2002-03 receded. Higher prices for livestock and crops during this period contributed to the upturn.
16.4 BROADACRE FARM BUSINESSES(a), Selected financial performance measures |
|  |
| Annual average per farm | 2001-02 | 2002-03 | 2003-04 | 2004-05 | 2005-06 |  |
|  |
| Total cash receipts | $'000 | 314.3 | 257.6 | 295.0 | 381.7 | 359.0 |  |
| less Total cash costs | $'000 | 213.5 | 205.8 | 230.0 | 308.9 | 277.7 |  |
| Farm cash income | $'000 | 100.8 | 51.8 | 65.0 | 72.8 | 81.3 |  |
| Farm business profit | $'000 | 42.4 | -27.4 | 4.5 | 3.7 | 8.6 |  |
| Profit at full equity(b) | $'000 | 63.0 | -6.6 | 30.4 | 32.4 | 41.5 |  |
| plus Capital appreciation | $'000 | 77.6 | 150.4 | 213.0 | 193.0 | 191.5 |  |
| Profit at full equity (incl. capital appreciation) | $'000 | 140.6 | 143.8 | 243.4 | 225.4 | 233.1 |  |
| Farm capital at 30 June | $'000 | 1 699.6 | 1 917.7 | 2 521.1 | 3 131.2 | 3 426.0 |  |
| Rate of return (excl. capital appreciation)(c) | % | 3.7 | -0.3 | 1.3 | 1.1 | 1.3 |  |
| Rate of return (incl. capital appreciation)(c) | % | 8.3 | 7.5 | 10.8 | 7.8 | 7.3 |  |
| Off-farm income(d) | $'000 | 25.3 | 29.0 | 27.0 | 27.6 | 31.2 |  |
|  |
| (a) Businesses classified to Group 012 in the Australian and New Zealand Standard Industrial Classification (ANZSIC), 1993 edition. |
| (b) Farm business profit, plus rent, interest and finance lease payments less depreciation on leased items. |
| (c) Computed by expressing profit at full equity as a percentage of total opening capital. |
| (d) Collected for owner-manager and spouse only. Includes income from wages, other businesses, investment and social welfare payments. Average for those responding farms for which details of off-farm income are available for both owner-manager and spouse. |
| Source: Australian Bureau of Agricultural and Resource Economics, 'Australian Farm Surveys Results - March 2007'. |
Farm cash income is a measure of the cash funds available for farm investment and consumption after paying all costs incurred in production, including interest payments, but excluding capital payments and payments to family workers. It is a short-term measure of farm income because it takes no account of depreciation on assets. With improved conditions in parts of Australia in 2004-05 and the spring of 2005-06, average farm cash income increased for the third consecutive year (graph 16.5). A 6% fall in cash receipts was more than off-set by a 10% fall in cash costs due to a reduction in expenditure on livestock purchases and feed.
16.5 Broadacre farm businesses, farm average cash income

Average farm business profit rose in 2005-06 to $8,600 from $3,700 the previous year (graph 16.6). Farm business profit is a longer-term measure of the profitability of farms because it takes account of depreciation and inventory changes.
16.6 Broadacre farm businesses, farm average business profit

For the broadacre industries as a group, rate of return (excluding capital appreciation) averaged 1.3% in 2005-06 (graph 16.7), up from 1.1% in 2004-05.
16.7 Broadacre farm businesses, rate of return (excluding capital appreciation)(a)

 Print Page