Contents >>
Population >>
Population projections – a tool for examining population ageing (Article)
FEATURE ARTICLE 1: POPULATION PROJECTIONS – A TOOL FOR EXAMINING POPULATION AGEING
Population projections are illustrations of growth and change in populations based on a set of assumptions about future trends in fertility, mortality and migration. It is important to recognise that projections are not predictions or forecasts, but are simply illustrations of the change in population which would occur if the assumptions were to prevail over the projected period. Population projections are useful because they highlight future change in population trends, such as population ageing.
In this article, data for Australia is based on ABS Series B population projections. For all other countries, data is from the United Nations Medium Variant population projections. Countries selected for analysis are Australia, Afghanistan, Canada, China, France, Greece, India, Indonesia, Iraq, Italy, Japan, the Republic of (South) Korea, Lebanon, Malaysia, New Zealand, Pakistan, Papua New Guinea, the Philippines, Singapore, South Africa, Sri Lanka, Sweden, the United Kingdom, the United States of America and Vietnam.
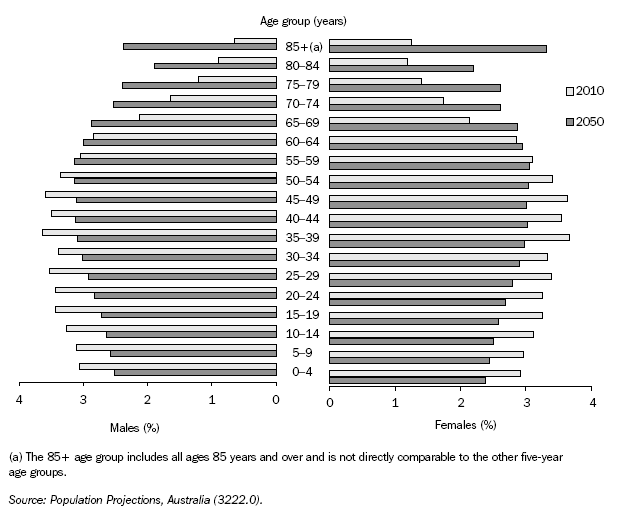
Ageing is the most noteworthy population change projected to occur internationally and in Australia over the next 50 years. Population ageing is the change in age structure where the population has an increasing proportion of older people (those aged 65 years and older) in comparison to the proportion of children (those aged 15 years and younger) and is a consequence of sustained low fertility and increasing life expectancy (graph 7.14).
7.14 Projected age distribution of population(a) - 30 June

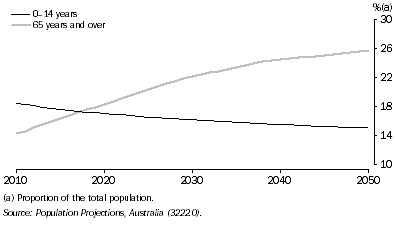
The number of people aged 65 years and over is projected to outnumber children aged 0-14 years in 2018 (graph 7.15). By 2050, 26% of the population is projected to be aged 65 years and over, in comparison to 15% of the population being aged 0-14 years.
7.15 Projected young and older Australians

Population ageing is already evident in countries such as Italy, Japan and Greece. In comparison, Papua New Guinea, South Africa and most Asian countries have an excess of 0-14 year olds to older people (for a definition of major areas and regions, see the United Nations website <
http://www.un.org>). However, this is a possible reflection of higher fertility rates and lower life expectancies at birth, than those experienced in other countries (table 7.16).
7.16 POPULATION CHARACTERISTICS, Selected countries |
|  |
 | 2010 | 2050 |  |
 | Aged 0-14 | Aged 15-64 | Aged 65+ | Median age | Total fertility rate(a) | Life expectancy(b) | Aged 0-14 | Aged 15-64 | Aged 65+ | Median age | Life expectancy(b) |  |
| Selected countries(c) | % | % | % | year | rate | years | % | % | % | years | years |  |
|  |
| Australia | 18.4 | 67.3 | 14.3 | 38.2 | 1.8 | 81.9 | 15.1 | 59.2 | 25.7 | 45.2 | 86.2 |  |
| Afghanistan | 46.3 | 51.5 | 2.2 | 16.7 | 7.1 | 43.8 | 33.7 | 62.9 | 3.4 | 23.0 | 58.7 |  |
| Canada | 16.2 | 69.6 | 14.2 | 40.0 | 1.5 | 80.7 | 15.6 | 58.7 | 25.7 | 45.3 | 85.3 |  |
| China (exl. SARs and Taiwan) | 19.6 | 72.0 | 8.4 | 34.9 | 1.7 | 73.0 | 15.3 | 61.0 | 23.7 | 45.0 | 79.3 |  |
| France | 18.2 | 65.2 | 16.5 | 40.0 | 1.9 | 80.7 | 16.0 | 58.1 | 25.9 | 44.7 | 85.1 |  |
| Greece | 13.9 | 67.3 | 18.8 | 41.9 | 1.3 | 79.5 | 13.3 | 55.0 | 31.7 | 50.1 | 84.1 |  |
| India | 30.7 | 64.0 | 5.3 | 25.0 | 2.8 | 64.7 | 18.2 | 67.3 | 14.5 | 38.6 | 75.6 |  |
| Indonesia | 26.7 | 67.3 | 6.1 | 28.2 | 2.2 | 70.7 | 17.5 | 64.0 | 18.6 | 41.1 | 78.6 |  |
| Iraq | 39.7 | 57.3 | 3.0 | 19.6 | 4.3 | 59.5 | 24.3 | 67.2 | 8.5 | 31.1 | 76.1 |  |
| Italy | 13.8 | 65.6 | 20.6 | 43.8 | 1.4 | 80.5 | 13.3 | 54.0 | 32.6 | 50.4 | 85.0 |  |
| Japan | 13.4 | 64.1 | 22.5 | 44.6 | 1.3 | 82.6 | 11.3 | 51.1 | 37.7 | 54.9 | 87.1 |  |
| Korea, Republic of (South) | 15.9 | 72.8 | 11.3 | 38.0 | 1.2 | 78.6 | 10.4 | 54.5 | 35.1 | 54.9 | 83.5 |  |
| Lebanon | 26.6 | 66.0 | 7.4 | 28.5 | 2.2 | 72.0 | 17.8 | 64.5 | 17.7 | 40.2 | 78.7 |  |
| Malaysia | 29.2 | 66.0 | 4.8 | 26.3 | 2.6 | 74.2 | 18.3 | 65.4 | 16.3 | 39.3 | 80.1 |  |
| New Zealand | 20.2 | 66.8 | 13.0 | 36.8 | 2.0 | 80.2 | 16.1 | 59.7 | 24.1 | 44.1 | 85.2 |  |
| Pakistan | 34.0 | 62.0 | 4.1 | 22.1 | 3.5 | 65.5 | 21.8 | 67.4 | 10.8 | 34.1 | 75.7 |  |
| Papua New Guinea | 38.7 | 58.8 | 2.5 | 20.3 | 3.8 | 57.2 | 23.8 | 68.9 | 7.3 | 30.9 | 67.8 |  |
| Philippines | 34.4 | 61.4 | 4.2 | 22.8 | 3.2 | 71.7 | 19.7 | 67.4 | 12.9 | 36.3 | 78.7 |  |
| Singapore | 15.5 | 74.3 | 10.1 | 40.6 | 1.3 | 80.0 | 11.1 | 56.0 | 32.8 | 53.7 | 84.6 |  |
| South Africa | 31.2 | 63.9 | 4.9 | 24.4 | 2.6 | 49.3 | 22.3 | 67.9 | 9.7 | 32.0 | 62.6 |  |
| Sri Lanka | 22.4 | 70.2 | 7.4 | 31.2 | 1.9 | 72.4 | 16.7 | 61.4 | 21.9 | 43.4 | 77.6 |  |
| Sweden | 16.3 | 65.3 | 18.4 | 41.1 | 1.8 | 80.9 | 16.4 | 59.4 | 24.1 | 43.3 | 85.2 |  |
| United Kingdom | 17.3 | 66.0 | 16.6 | 40.0 | 1.8 | 79.4 | 16.2 | 59.7 | 24.1 | 43.4 | 84.1 |  |
| United States of America | 20.1 | 67.1 | 12.8 | 36.5 | 2.1 | 78.2 | 17.3 | 61.7 | 21.0 | 41.1 | 83.1 |  |
| Vietnam | 26.3 | 68.1 | 5.6 | 26.9 | 2.1 | 74.2 | 17.2 | 63.6 | 19.2 | 41.6 | 80.3 |  |
|  |
| (a) Births per woman. United Nations and ABS projections are medium variant projections for the period 2005-2010. |
| (b) Life expectancy at birth. United Nations and ABS projections are medium variant projections for the period 2005-2010 and 2045-50, for males and females combined. |
| (c) International data are United Nations medium variant projections. Australian data are ABS medium series (Series B) projections. |
| Source: United Nations World Population Prospects, 2006 Revision. |
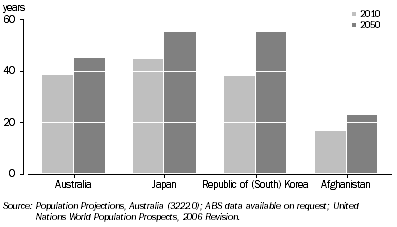
Population ageing can also be demonstrated by examining median age. The median age is the age at which half the population is older and half is younger. All countries, across the globe, are projected to experience an increase in median age between 2010 and 2050.
Australia's projected median age of 38.2 years in 2010 is expected to increase to 45.2 years in 2050. By 2050 Japan and the Republic of (South) Korea are projected to experience the highest median age, of 54.9 years. For the Republic of (South) Korea, this is the result of an increase of 16.9 years, from a median age of 38.0 in 2010. Afghanistan's median age is also projected to increase, despite having a higher fertility rate, from 16.7 years in 2010 to 23.0 years in 2050 (graph 7.17).
7.17 Median age, by selected countries

In Australia, and in the majority of countries selected for analysis, the proportion of the population of working age is decreasing (for the purposes of this article, working age population is defined as those aged 15-64 years). The proportion of the working age population in Australia will decrease from 67.3% in 2010 to 59.2% in 2050. This decrease is mainly caused by the proportion of the population born between the years of 1946 and 1953 leaving the working age population. This cohort of 'baby boomers' will begin to reach retirement age of 65 years by 2011. Meanwhile the number of 15 year olds entering the working age population will decline as a proportion of the total population.
The decrease in the relative size of the working age group is expected to have significant implications for Australia, especially in terms of labour force participation, a shrinking tax base and demand for skilled labour. Skilled migrants from overseas will also be in short supply since the decrease in the working age population is occurring internationally.
India, Papua New Guinea, the Philippines, South Africa, Afghanistan, Iraq and Pakistan are the only countries selected for analysis that are expected to experience an increase in the proportion of those aged 15-64 years between the years 2010 and 2050. Again, this is a possible reflection of considerably higher fertility rates and lower life expectancies at birth than other countries.
Population projections are useful tools for governments, academics and researchers around the world. They allow for examination and planning for possible future population scenarios, if current trends in fertility, mortality and migration continue. In Australia, the first and second Intergenerational Reports have been used to guide government policy decisions.
Population ageing is occurring around the world, and it is unlikely to be reversed. Even countries like Afghanistan and South Africa are ageing, although they have high (albeit decreasing) fertility rates. It is important to note again that population projections are not 'predictions' or 'forecasts'. If fertility rates rise, or life expectancies start decreasing, or some other unknown variable occurs, then population trends could look quite different by the year 2050.
References
For more information about ABS population projections see
Population Projections, Australia, 2004 to 2101 (3222.0) on the ABS website <
https://www.abs.gov.au>
Department of the Treasury:
Intergenerational Report 1, 2002 Intergenerational Report 2, 2007
Productivity Commission 2005,
Economic Implications of an Ageing Australia, Research Report, Canberra
United Nations 2006,
World Population Prospects: The 2006 Revision, Department of Economic and Social Affairs Population Division
 Print Page