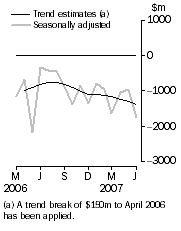
JUNE KEY FIGURES
 | April 2007 | May 2007 | June 2007 | May 07 to Jun 07 |  |
 | $m | $m | $m | % change |  |
TREND |  |
|  |
| Balance on goods and services | -1 233 | -1 314 | -1 373 | . . |  |
| Credits (exports of goods & services) | 18 212 | 18 224 | 18 219 | - |  |
| Debits (imports of goods & services) | 19 446 | 19 539 | 19 592 | - |  |
SEASONALLY ADJUSTED |  |
|  |
| Balance on goods and services | -1 050 | -970 | -1 751 | . . |  |
| Credits (exports of goods & services) | 18 131 | 18 594 | 17 962 | -3 |  |
| Debits (imports of goods & services) | 19 182 | 19 564 | 19 713 | 1 |  |
|  |
| . . not applicable |
| - nil or rounded to zero (including null cells) |
Balance on Goods and Services

|  |
JUNE KEY POINTS
TREND ESTIMATES
- The provisional trend estimate of the balance on goods and services was a deficit of $1,373m in June 2007, an increase of $59m on the revised deficit in May, mainly as a result of an increase in goods and services debits.
SEASONALLY ADJUSTED ESTIMATES
- In seasonally adjusted terms, the balance on goods and services was a deficit of $1,751m in June, an increase of $781m on the revised deficit in May.
- Goods and services credits fell $632m (3%) to $17,962m. Non-rural and other goods fell $577m (5%) and rural goods fell $82m (4%). Services credits rose $26m (1%).
- Goods and services debits rose $149m (1%) to $19,713m. Intermediate and other goods rose $342m (5%) while capital goods fell $186m (5%) and consumption goods fell $18m. Services debits rose $10m.
ORIGINAL ESTIMATES
- In original terms, the June 2007 balance on goods and services was a deficit of $1,703m, an increase of $925m on the revised deficit in May. Goods and services credits fell $858m (5%) and goods and services debits rose $67m.
2006-07 SITUATION
- For 2006-07, the balance on goods and services was a deficit of $12.0b. This is a decrease of $2.5b on the 2005-06 deficit resulting from a $19.6b (10%) increase in exports offset by a $17.1b (8%) increase in imports of goods and services.
- Exports of non-rural and other goods were up $15.4b (12%) while rural goods were down $0.2b (1%) compared to 2005-06.
NOTES
FORTHCOMING ISSUES
| ISSUE | Release Date |
| July 2007 | 31 August 2007 |
| August 2007 | 3 October 2007 |
| September 2007 | 1 November 2007 |
| October 2007 | 3 December 2007 |
| November 2007 | 10 January 2008 |
| December 2007 | 4 February 2008 |
REVISIONS
Revisions were made to incorporate the latest available data relating to merchandise trade, the quarterly survey of international trade in services and other administrative data. In original terms, these revisions have:
- increased the deficit on goods and services for May 2007 by $124m
- increased the deficit on goods and services for the 11 months to May 2007 by $371m, of which, $156m is due to the Change to this Issue detailed below.
CHANGE TO THIS ISSUE
Commencing with this issue, goods debits (imports) on a balance of payments basis will use the Customs values (CV) from the merchandise trade data rather than Free on Board values (f.o.b.). The CV is similar to the f.o.b. value except that it includes the revaluation of some goods imports by Customs to more closely reflect their market value. Market value measures are the standard required for both Balance of Payments and the System of National Accounts. To align with the National Accounts revisions policy, revisions to the balance of payments goods debits data have only been made back to July 2006. These are all upward revisions and range in total from $13m to $19m per month across a number of commodity groups. These revisions will also be applied to data released in the June quarter 2007 issue of
Balance of Payments and International Investment Position, Australia (cat. no. 5302.0) to be released on 30 August 2007.
INQUIRIES
For further information about these and related statistics, contact the National Information and Referral Service on 1300 135 070 or Tom Jebbink on Canberra (02) 6252 5540.
 Print Page
 Print All