Education News - ABS Education Services
This newsletter highlights the latest curriculum related teaching resources, student activities and statistical tools that have been developed by ABS Education Services as well as other ABS resources that are useful for schools.
Contents
- Census 2006 - MapStats
- Grade 6 students learn from Census
- An idea for the classroom
- Subscribe to Education News
- CensusAtSchool
- Recently Released Publications
Census 2006 - MapStats
Data from Census 2006 is being released in new, easy to use formats. In the last Education News, we showed you how to use QuickStats (a summary of key census data relating to persons, families and dwellings, presented in tabular form). Another of the new census products that can be used effectively in the classroom is
MapStats. MapStats is designed to provide users with quick and easy access to thematically mapped census statistics. The maps depict graphically selected characteristics from census: population, ethnicity, education, family, income, dwelling and labour force.
Here is how to do it.
1. Go to the ABS Census home page (www.abs.gov.au/census).
2. Choose MapStats
3. You will see the page below. If you want a State or city, you can choose it from this page. Otherwise select Search from the tabs (Search, Address, State and Cities, Browse, Map).

4. Type in the location in which you are interested, for example a suburb, postcode, LGA etc. (You can also type in an address on the Address Search page, or use Browse or Map.)
5. Press the Search button
6. All areas that include what you have typed will be listed. Scroll through the list and highlight the particular location that you want. A map will appear so that you can check it is the correct area.
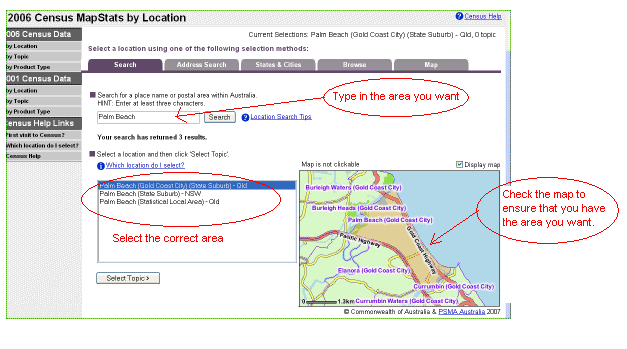
7. Choose Select Topic.
8. You will be asked to choose the 'count method'. Census data is available based on 'location on census night' and on 'place of usual residence'. Always check the count method of any Census data that you use. You cannot directly compare data unless the count method is the same.
9. Select a topic from the drop down list. Select the particular data that you want, then press 'Select sub location'.
10. Choose how you want your map broken up.
11. Click 'View MapStats'.
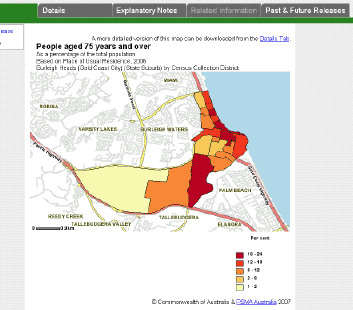
Always check the key on the map as the groupings vary from one location to another and one topic to another. The groupings are dependent on the particular values for that variable and that location. This is why care must be taken when comparing maps.
 |  |
Next time: Census Tables
Grade 6 students learn from Census
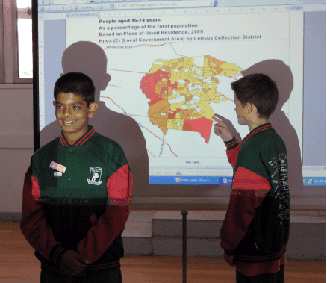
Grade 6 students at the Regency Park Primary School in Wantirna were congratulated by Mr Chris Pearce, the Parliamentary Secretary to the Treasurer, for their work on an educational exercise based on Census 2006 data. The students used QuickStats, Census Tables and MapStats to examine a number of features of their local area. For example they compared the changes in the age of residents in the area over time, as well as with Australia as a whole.
Mr Pearce was visiting Regency Park to view the students' work and promote the use of Census data. "Census information is an invaluable tool used by all Australians for all kinds of worthwhile purposes from government planning to students doing assignments", he said.
As well as using Census 2006 information, Regency Park students have been involved in CensusAtSchool. They have enjoyed using real data to find out about their fellow students and their community.
An Idea for the Classroom
Migration to Australia
The Education pages on the ABS web site include a number of ABS datasets. The presentation has been modified for classroom use but you and your students can check the original source for further information, clarification or extension.
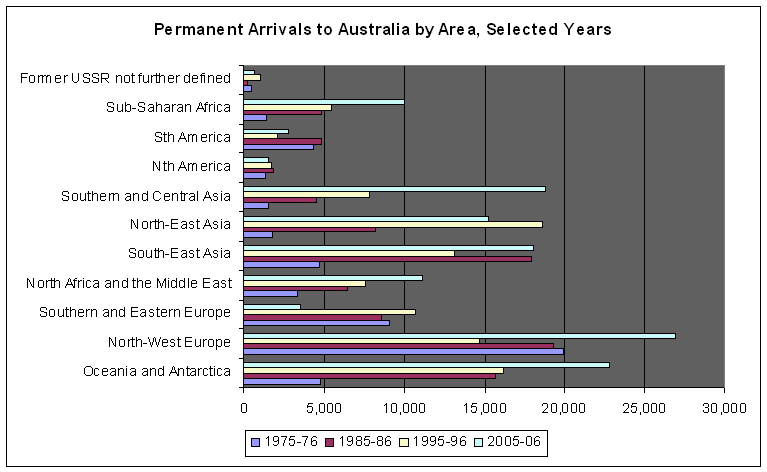
 One such table is Migration Permanent Arrivals which lists the countries from where permanent arrivals to Australia have come for the years 1975-76, 1985-86, 1995-96 and 2005-06. This information could be used in a number of classrooms (Maths, SOSE, HSIE,) or in cross curricula units. One such table is Migration Permanent Arrivals which lists the countries from where permanent arrivals to Australia have come for the years 1975-76, 1985-86, 1995-96 and 2005-06. This information could be used in a number of classrooms (Maths, SOSE, HSIE,) or in cross curricula units.
Some questions your students could answer include: How has Australia's immigration pattern changed over time? What proportion of permanent arrivals come from which parts of the world? These questions involve, amongst other things, maths (proportions, percentages, graphing, classifying and analysing data, etc), history (what events may have precipitated the increase or decrease in arrivals?), and social issues (why have these changes occurred? how has Australia responded? what impact have these changes had?).
The bar graph below is an example of the type of comparisons students can make using this Data Set. It shows the numbers of permanent arrivals to Australia for the years 1975-76, 1985-86, 1995-96 and 2005-06 by area.
Do you have a classroom idea that uses ABS data or ABS Education products? Let us know at education@abs.gov.au and we'll share it around Australia.
CensusAtSchool
 Over a quarter of all Australian schools completed CensusAtSchool 2006 and there are more than 112,000 student responses that you can access now via the Random Sampler. Because CensusAtSchool is such a flexible resource, teachers are using it across the curriculum and from Grade 5 to Year 12. You can access CensusAtSchool directly from www.abs.gov.au/censusatschool. There is also a free DVD and CD to help you use this invaluable resource. Contact the CensusAtSchool team to receive your copy. Over a quarter of all Australian schools completed CensusAtSchool 2006 and there are more than 112,000 student responses that you can access now via the Random Sampler. Because CensusAtSchool is such a flexible resource, teachers are using it across the curriculum and from Grade 5 to Year 12. You can access CensusAtSchool directly from www.abs.gov.au/censusatschool. There is also a free DVD and CD to help you use this invaluable resource. Contact the CensusAtSchool team to receive your copy.
Planning for CensusAtSchool 2008 is well under way. From early next year, your students will be able to complete the 2008 questionnaire, which will include 11 international questions. Don't forget CensusAtSchool is suitable for use in classes from Grade 5 to Year 12 and from Maths to Geography, Health to Commerce, and Science to PE. Register now for 2008. (Schools registered for 2006 do not need to re-register.)
Subscribe to Education News.
Education News is a convenient way to keep up to date with ABS data that is useful for the classroom, as well as get tips on classroom activities. Now you can automatically receive notification when a new edition is released. Simply follow this link, scroll down, type in your email address and submit. |  |
Alternatively you can click 'Free email notification service' on the ABS home page. You will need to go to the 'Advanced' tab to specifically request Education News.
|
 |
Recently Released Publications
Household Income and Income Distribution, Australia 2005-06 (cat. no. 6523.0)
Provides estimates of income received by households, classified by various characteristics. Also includes summary measures of the distribution of household income in Australia. Classifications used to describe households include income quintile, net worth quintile, principal source of household income, family composition, tenure type, and geographic location. For each category of household, estimates of net worth, household size, and other characteristics are provided in addition to the estimates of income.
 Print Page
 Print All