NOTES
ABOUT THIS PUBLICATION
This publication contains experimental estimates of the Aboriginal and Torres Strait Islander (Indigenous) population of Australia based on the 2001 Census of Population and Housing. It also contains experimental projections of the Indigenous population for the period 2002 to 2009. Descriptions of the methods used to produce the estimates and projection assumptions are included. Experimental estimates and projections based on the 1996 Census of Population and Housing were published separately in Experimental Estimates of the Aboriginal and Torres Strait Islander Population, 1991 to 1996 (cat. no. 3230.0) and Experimental Projections of the Aboriginal and Torres Strait Islander Population, 1996 to 2006 (cat. no. 3231.0). The estimates and projections for each year are as at 30 June.
This publication includes experimental estimates of the Indigenous population at 30 June 2001 for the 36 Aboriginal and Torres Strait Islander Commission regions.
ACCURACY
The projection results are not intended as predictions or forecasts, but are illustrations of growth and change in the population which would occur if the assumptions about future demographic trends prevail over the projection period.
ROUNDED FIGURES
Population figures in the text of this publication are rounded. While unrounded figures are provided in tables, accuracy to the last digit is not claimed and should not be assumed.
INQUIRIES
For further information about these and related statistics, contact the National Information and Referral Service on 1300 135 070 or Shahidullah on Canberra (02) 6252 5129.
SUMMARY COMMENTARY
MAIN FEATURES
INTRODUCTION
The estimates and projections of the Aboriginal and Torres Strait Islander (Indigenous) population presented in this publication are experimental. The significant intercensal volatility in Indigenous census counts and the quality of the data on births, deaths and migration do not support the standard approach to population estimation.
The estimated Aboriginal and Torres Strait Islander population of Australia as at 30 June 2001, was 458,500, or 2.4% of the total Australian population. Indigenous people of Aboriginal origin only, comprised 89% of the total Indigenous population; people of Torres Strait Islander origin only, comprised 6% and those of both Aboriginal and Torres Strait Islander origin comprised 4%.
Estimated resident Indigenous population - 30 June 2001 |
|  |
 | Indigenous population | Proportion of total Indigenous population | Proportion of total state or territory population |  |
| State or territory | '000 | % | % |  |
|  |
| New South Wales | 134.9 | 29.4 | 2.1 |  |
| Victoria | 27.8 | 6.1 | 0.6 |  |
| Queensland | 125.9 | 27.5 | 3.5 |  |
| South Australia | 25.5 | 5.6 | 1.7 |  |
| Western Australia | 65.9 | 14.4 | 3.5 |  |
| Tasmania | 17.4 | 3.8 | 3.7 |  |
| Northern Territory | 56.9 | 12.4 | 28.8 |  |
| Australian Capital Territory | 3.9 | 0.9 | 1.2 |  |
| Australia(a) | 458.5 | 100.0 | 2.4 |  |
|  |
| (a) Includes Other Territories. |
REGIONAL COMPARISONS
The Aboriginal and Torres Strait Islander Commission (ATSIC) regions with the largest number of Indigenous people were Sydney (43,100 or 9%), Brisbane (39,000 or 9%), Coffs Harbour (36,100 or 8%), Wagga Wagga (24,100 or 5%) and Perth (23,200 or 5%). These five regions accounted for 165,500 or 36% of the total Indigenous population in 2001.
More than half of the Torres Strait Islander population (59%) lived in Queensland, while the remaining 41% were dispersed throughout the rest of Australia. The ATSIC regions with the largest number of Torres Strait Islanders were Torres Strait Area (6,900 or 14%), Cairns (6,200 or 13%), Brisbane (5,600 or 12%) and Townsville (5,400 or 11.0%).
GROWTH RATE
The 30 June 1996 and 30 June 2001 estimates of the Indigenous population of Australia, both based on the 2001 census, were 414,400 and 458,500 respectively. The average annual growth rate of the Indigenous population of Australia for the period 1996 to 2001 was 2.0%.
Unexplained growth
The previously published experimental Indigenous population estimate for 1996, based on the 1996 census, was 386,000. The upward revision of the 1996 estimate to 414,400 reflects the increase in the census count between 1996 and 2001 that cannot be explained by births and deaths (natural increase). For the purposes of estimating the Indigenous population it is assumed that the 2001 census is a better count of the Indigenous population. The experimental Indigenous population estimates for all years from 1991 to 2000 are therefore calculated using the 2001 population estimates and the experimental Indigenous life tables to 'reverse survive' the population back to 1991 (see paragraphs 19-21 of the Explanatory Notes for more detail).
SEX RATIOS
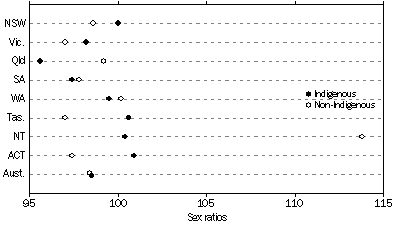
The ratio of males to females at 30 June 2001 was similar for both the Indigenous population (98.5 males per 100 females) and the non-Indigenous population (98.4 males per 100 females). For the Indigenous population, sex ratios ranged from 95.6 in Queensland to 100.9 in the Australian Capital Territory, while sex ratios for the non-Indigenous population ranged from 97.0 in Victoria and Tasmania to 113.8 in the Northern Territory.
Sex ratios of the Indigenous and Non-Indigenous populations - 30 June 2001

A YOUNG INDIGENOUS POPULATION
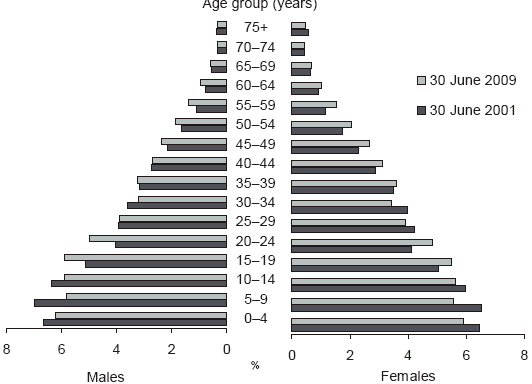
The much younger age structure of the Indigenous population is largely a product of high levels of fertility and mortality compared with the non-Indigenous population. In 2001, the proportion of Indigenous people under 15 years of age was 39% compared with 20% of non-Indigenous people. Persons aged 65 years and over comprised 3% of the Indigenous population and 13% of the non-Indigenous population. The age structure of the male Indigenous population is similar to that of the female Indigenous population.
Using specific assumptions about fertility, mortality and migration and two assumptions about future unexplained growth in the census counts, two series of projections of the Indigenous population have been generated. For more information, see the Assumptions - High and Low Series Projections section. The proportion of the total Indigenous population aged under 15 years is projected to fall from 39% at June 2001 to 35% in 2009 in both the high and low series.
Indigenous persons aged 65 years and over comprised 3% of the total Indigenous population in 2001. This proportion would remain unchanged in 2009 in both series.
Median age
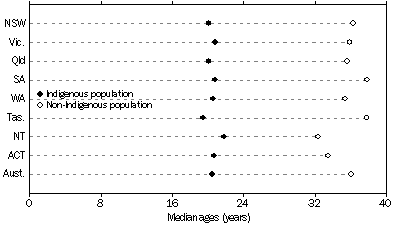
At 30 June 2001, Australia's Indigenous population had a median age of 20.5 years, about 16 years younger than the median age for the non-Indigenous population (36.1 years). The median age of the Indigenous population ranged from 19.5 years in Tasmania to 21.8 years in the Northern Territory. The median age of the non-Indigenous population ranged from 32.4 years in the Northern Territory to 37.9 years in South Australia. The median age was 19.6 years for Indigenous males and 21.4 years for Indigenous females compared with 35.3 years for non-Indigenous males and 36.8 years for non-Indigenous females.
In 2009, the median age of Indigenous people is projected to increase to 21.8 years for both series.
Median ages of the Indigenous and Non-Indigenous populations - 30 June 2001

The experimental estimate of life expectancy at birth for persons of Indigenous origin born in the period 1996-2001 was 59.4 years for males and 64.8 years for females. This compares with a life expectancy for all Australian males and females of 76.2 years and 81.8 years respectively for persons born in the period 1997-1999 and 77.4 years and 82.6 years respectively for persons born in the period 2000-2002.
A GROWING POPULATION
Assuming no further unexplained growth in census counts of the Indigenous population, referred to in this publication as the 'low series' projections, the Indigenous population would grow from 458,500 persons in 2001 to 528,600 in 2009. New South Wales would have the largest Indigenous population in 2009 (153,500 persons), followed by Queensland (148,100 persons), Western Australia (76,300 persons), Northern Territory (63,800 persons), Victoria (33,000 persons), South Australia (29,700 persons), Tasmania (19,400 persons) and the Australian Capital Territory (4,700 persons).
If the unexplained growth between the 1996 and 2001 censuses were projected to continue into the future, referred to in this publication as the 'high series', the Indigenous population would rise to 600,200 in 2009. The New South Wales Indigenous population in 2009 would be 182,900 persons, and in Queensland it would be 169,300 persons.
PROJECTED INDIGENOUS POPULATION, LOW SERIES-AUSTRALIA

 Print Page
 Print All