MARCH KEY FIGURES
 | January 2006 | February 2006 | March 2006 | Feb 06 to Mar 06 |  |
 | $m | $m | $m | % change |  |
Trend |  |
|  |
| Balance on goods & services | -1 512 | -1 411 | -1 307 | . . |  |
| Credits (exports of goods & services) | 16 060 | 16 273 | 16 434 | 1 |  |
| Debits (imports of goods & services) | 17 572 | 17 684 | 17 741 | - |  |
Seasonally Adjusted |  |
|  |
| Balance on goods & services | -2 422 | -415 | -1 545 | . . |  |
| Credits (exports of goods & services) | 15 372 | 16 958 | 16 072 | -5 |  |
| Debits (imports of goods & services) | 17 794 | 17 373 | 17 617 | 1 |  |
|  |
| . . not applicable |
| - nil or rounded to zero (including null cells) |
Balance on goods and services
|  |
MARCH KEY POINTS
TREND ESTIMATES
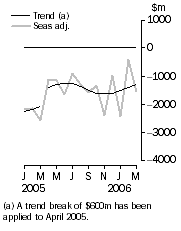
- The provisional trend estimate of the balance on goods and services was a deficit of $1,307m in March 2006, a decrease of $104m on the revised deficit in February.
- Goods and services credits rose $161m (1%) to $16,434m. Goods and services debits rose $57m to $17,741m.
SEASONALLY ADJUSTED ESTIMATES
- In seasonally adjusted terms, the balance on goods and services was a deficit of $1,545m in March, an increase of $1,130m on the revised deficit in February.
- Goods and services credits fell $886m (5%) to $16,072m. Non-rural and other goods fell $1,009m (9%) while rural goods rose $153m (7%). Services credits fell $30m (1%).
- Goods and services debits rose $244m (1%) to $17,617m. Capital goods rose $410m (13%), consumption goods rose $46m (1%), while intermediate and other goods fell $176m (3%). Services debits fell $36m (1%).
ORIGINAL ESTIMATES
- In original terms, the March balance on goods and services was a deficit of $1,158m, a turnaround of $1,165m on the revised surplus of $7m in February. Goods and services credits rose $931m (6%) and goods and services debits rose $2,096m (13%).
- In the nine months to March, exports of non-rural and other goods were up $19.9b (27%) while rural goods were down $0.6b (3%) on the corresponding period in 2004-05.
NOTES
FORTHCOMING ISSUES
| ISSUE | Release Date |
| April 2006 | 31 May 2006 |
| May 2006 | 14 July 2006 |
| June 2006 | 11 August 2006 |
| July 2006 | 8 September 2006 |
| August 2006 | 4 October 2006 |
| September 2006 | 2 November 2006 |
DELAYS TO UPCOMING PUBLICATIONS
The ABS is implementing a new system for processing merchandise trade data. The release of merchandise trade imports and exports will be delayed to allow additional quality assurance to be undertaken during the implementation of the new system.
The new system will be implemented in September quarter 2006.
As merchandise trade statistics and trade in goods on a balance of payments basis are presented in this publication, the ABS has delayed the release of upcoming issues for May 2006 through to July 2006. If additional small delays are required for subsequent issues, they will be advised in future releases of this publication.
The table below provides the previously advertised and new release dates for this publication.
| ISSUE | Previous release date | New release date |
| May 2006 | 4 July 2006 | 14 July 2006 |
| June 2006 | 2 August 2006 | 11 August 2006 |
| July 2006 | 31 August 2006 | 8 September 2006 |
REVISIONS
Revisions were made to incorporate the latest available data relating to merchandise trade and trade in services. In original terms, these revisions have:
- decreased the deficit on goods and services for February 2006 by $112m resulting in a surplus of $7m
- decreased the deficit for the eight months to February 2006 by $71m.
UPDATED TIME SERIES
Updated data cubes on Australia's international trade in services by partner country and international trade in services by state for the calendar year 2005 and for the financial year 2004-05 will be released with this issue. They can be accessed on the ABS web site www.abs.gov.au via catalogue numbers 5368.0.55.004 and 5368.0.55.003 respectively. The data cubes have been allocated separate catalogue numbers to assist clients in locating them on the web site.
FEATURE ARTICLE
A feature article addressing the methodology for compiling counts of the number of exporters was released on 7 April 2006. The article can be accessed on the ABS web site www.abs.gov.au from the summary page of the February 2006 issue of this publication.
INQUIRIES
For further information about these and related statistics, contact the National Information and Referral Service on 1300 135 070 or Tom Jebbink on Canberra (02) 6252 5540.
ANALYSIS AND COMMENTS
BALANCE ON GOODS AND SERVICES
The trend estimate of the balance on goods and services in March 2006 was a deficit of $1,307m, a decrease of $104m on the deficit in February.
In seasonally adjusted terms, the balance on goods and services in March 2006 was a deficit of $1,545m, an increase of $1,130m on the deficit in February.
The sum of the seasonally adjusted balances for the three months to March 2006 was a deficit of $4,382m, a decrease of $325m on the deficit of $4,707m for the three months to December 2005. However, if the seasonal factors used in compiling quarterly Balance of Payments are applied, the preliminary March quarter 2006 deficit was $4,676m, an increase of $502m on the revised December quarter 2005 deficit of $4,174m.
EXPORTS OF GOODS AND SERVICES
The trend estimate of goods and services credits rose $161m (1%) between February and March to $16,434m.
In seasonally adjusted terms, goods and services credits fell $886m (5%) to $16,072m. Non-rural and other goods fell $1,009m (9%) while rural goods rose $153m (7%). Services credits fell $30m (1%).
Exports of goods
GOODS CREDITS
Rural goods
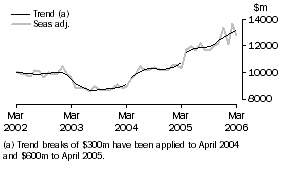
The trend estimate of rural goods exports rose $35m (2%) to $2,194m.
In seasonally adjusted terms, exports of rural goods rose $153m (7%) to $2,260m.
All seasonally adjusted components of rural goods contributed to the rise with:
- cereal grains and cereal preparations, up $76m (18%)
- other rural, up $35m (4%)
- wool and sheepskins, up $26m (13%)
- meat and meat preparations, up $16m (3%).
In original terms, exports of rural goods rose $326m (16%) to $2,339m.
Non-rural goods
The trend estimate of non-rural goods exports rose $60m (1%) to $10,019m.
In seasonally adjusted terms, exports of non-rural goods fell $940m (9%) to $9,674m.
The main movements in the seasonally adjusted components contributing to the
fall were:
- metal ores and minerals, down $471m (18%)
- other mineral fuels, down $398m (29%)
- metals (excluding non-monetary gold), down $68m (7%)
- other non-rural, down $42m (4%)
- other manufactures, down $29m (2%).
Partly offsetting these effects were:
- coal, coke and briquettes, up $48m (2%)
- transport equipment, up $21m (5%).
Movements in the original series contributing to the fall in seasonally adjusted
terms were:
- metal ores and minerals, down $109m (5%), in contrast to an average February to March rise of 24% over the previous three years, largely driven by:
- copper ore, down $135m (37%), on decreased volumes
- non-agglomerated iron ore, down $81m (8%), with volumes down 12% and prices up 4%.
- other mineral fuels, down $230m (19%), in contrast to an average February to March rise of 14% over the previous three years, largely driven by decreased volumes for:
- crude oil, down $144m (26%)
- LNG exports, down $90m (25%).
- metals (excluding non-monetary gold), up $129m (14%), compared to an average February to March rise of 27% over the previous three years, largely due to copper and aluminium exports not sustaining the previous three year average increase.
Consistent with reporting by market commentators and the press, export volumes of iron ore, crude oil and LNG have been adversely impacted by cyclones in the Pilbara region of Western Australia during the first quarter of 2006, with temporary closures of operations and some flooding of mining sites.
Other goods
The trend estimate of other goods exports rose $37m (4%) to $947m.
In seasonally adjusted terms, exports of other goods fell $69m (7%) to $878m.
The main component contributing to the fall in the seasonally adjusted estimates was non-monetary gold, down $103m (16%), partly offset by goods for processing, up $26m (15%).
Exports of services
SERVICES CREDITS
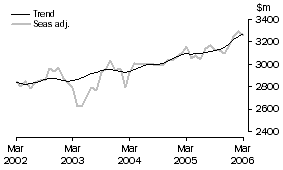
In trend terms, services credits rose $29m (1%) to $3,274m.
Seasonally adjusted, services credits fell $30m (1%) to $3,260m.
The movements in the seasonally adjusted components contributing to this fall were:
- travel services, down $12m (1%)
- other services, down $12m (1%)
- transportation services, down $6m (1%).
Seasonally adjusted, tourism related services credits fell $16m (1%) to $2,069m.
IMPORTS OF GOODS AND SERVICES
The trend estimate of goods and services debits rose $57m between February and March to $17,741m.
In seasonally adjusted terms, goods and services debits rose $244m (1%) to $17,617m. Capital goods rose $410m (13%), consumption goods rose $46m (1%), other goods rose $66m (11%), while intermediate and other merchandise goods fell $242m (4%). Services debits fell $36m (1%).
Imports of goods
GOODS DEBITS
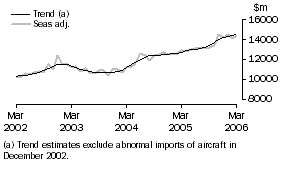
Preliminary analysis shows that goods imports volumes, in seasonally adjusted terms, increased about 0.9% during the March quarter 2006. The Chain Laspeyres price index rose about 2.3% and the implicit price deflator rose about 2.5%. The final volume and price outcomes will be published in the March quarter 2006 issue of Balance of Payments and International Investment Position, Australia (cat. no. 5302.0).
Consumption goods
The trend estimate of imports of consumption goods fell $6m to $4,194m.
In seasonally adjusted terms, imports of consumption goods rose $46m (1%) to $4,144m.
The components contributing to the rise in the seasonally adjusted estimates were:
- non-industrial transport equipment, up $31m (3%)
- textiles, clothing and footwear, up $20m (4%)
- household electrical items, up $13m (4%).
Partly offsetting these effects were:
- food and beverages for consumption, down $9m (2%)
- toys, books and leisure goods, down $8m (2%).
In original terms, imports of consumption goods rose $502m (14%) to $4,131m
Capital goods
The trend estimate of imports of capital goods fell $5m to $3,544m.
In seasonally adjusted terms, imports of capital goods rose $410m (13%) to $3,615m.
All components contributed to the rise in the seasonally adjusted estimates. The main movements were:
- civil aircraft, up $195m
- machinery and industrial equipment, up $76m (6%)
- industrial transport equipment n.e.s., up $63m (12%)
- capital goods n.e.s., up $57m (14%).
In original terms, imports of capital goods rose $869m (32%) to $3,551m.
Intermediate and Other Merchandise Goods
The trend estimate of imports of intermediate goods rose $30m to $6,087m.
In seasonally adjusted terms, intermediate goods imports fell $242m (4%) to $5,991m.
The main components contributing to the fall in the seasonally adjusted estimates were:
- processed industrial supplies n.e.s., down $121m (10%)
- fuel and lubricants, down $68m (3%)
- organic and inorganic chemicals, down $66m (18%).
Partly offsetting these effects was iron and steel, up $13m (5%).
In original terms, intermediate and other merchandise goods rose $387m (7%) to $6,306m.
Other Goods
The trend estimate of imports of other goods rose $39m (6%) to $653m.
In seasonally adjusted terms, other goods imports rose $66m (11%) to $643m.
The main component contributing to the rise in the seasonally adjusted estimates was goods for processing, up $61m (14%).
In original terms, other goods imports rose $70m (12%) to $647m.
Imports of services
SERVICES DEBITS
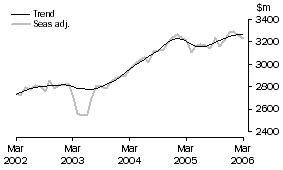
In trend terms, services debits fell $1m to $3,263m.
Seasonally adjusted, services debits fell $36m (1%) to $3,224m.
The movements in the seasonal components contributing to this fall were:
- transportation services, down $41m (3%), with freight services down $53m
- other services, down $7m (1%).
Partly offsetting these effects was travel services, up $12m (1%).
Seasonally adjusted, tourism related services debits rose $15m (1%) to $1,665m.
 Print Page
 Print All