|
|
CONTRIBUTION OF MIGRATION TO POPULATION GROWTH
- In 2002-03, 52% of Australia's population growth was from net overseas migration (NOM). The preliminary estimate of net overseas migration was 125,300, while natural increase was 115,200 and total growth was 240,500.
- In 2002-03, net permanent movement contributed 43,500 people (35%) to net overseas migration, while net long-term movement contributed 81,800 people (65%). For the first time, components of overseas migration are presented as adjusted figures - see Chapter 6, 'Special Article: Adjustments to Overseas Migration Estimates'.
- The method of preliminary distribution of net overseas migration among the states and territories is under review, and for 2002-03, net overseas migration for each state and territory is only available on a preliminary basis.
- New South Wales received the largest share of net overseas migration (40%), which exceeded the share of population of Australia living there (34%). Queensland had the second largest share of net overseas migration (24%), followed by Victoria (18%), Western Australia (14%) and South Australia (3%). The Australian Capital Territory, the Northern Territory and Tasmania (less than 1% each) had the smallest shares.
- The contribution of net overseas migration to total population growth ranged from 85% in New South Wales to 15% in Tasmania. The Northern Territory's population declined by 310 despite a positive contribution from net overseas migration of 240.
PERMANENT MOVEMENT
- Preliminary net permanent movement comprised 43,500 people in 2002-03, 4,900 more than in 2001-02.
- There were 93,900 permanent (settler) arrivals in 2002-03, an increase of 11% on the previous year. This number does not include those who arrived on a temporary basis and were subsequently granted permanent residency (these on-shore grants of permanent residency are not included in this publication).
- In 2002-03, 13% of all permanent arrivals had been born in the United Kingdom and another 13% in New Zealand. New Zealand was the most common source country of permanent arrivals in 2001-02, but declined by 21% to 12,400 in 2002-03.
- There were 50,500 permanent departures in 2002-03, an increase of 10% on 2001-02, continuing the pattern of annual increase which occurred in most years since 1986-87 and the highest level recorded over the past two decades.
- Of all permanent departures, people born in Australia comprised 51% in 2002-03, slightly higher than in 2001-02 (50%).
LONG-TERM MOVEMENT
- In 2002-03, net long-term movement contributed 81,800 people, an increase of 14% from 2001-02.
- Due to a new method of adjusting net overseas migration, long-term movement for 2001-02 on is not comparable with earlier published figures - for more information, see Chapter 6, 'Special Article: Adjustments to Overseas Migration Estimates'.
- Overseas visitors comprised 71% of all long-term arrivals in 2002-03, down slightly from 72% in 2001-02, whereas they comprised 34% of long-term departures in 2002-03 and 32% in 2001-02.
- In 2001-02, the United Kingdom was the most common country of citizenship of all long-term visitor arrivals.
- The median age of long-term visitor arrivals in 2001-02 was 30.0, with slightly more females than males (a sex ratio of 118 males per 100 females).
OVERSEAS-BORN POPULATION
- At 30 June 2002, Australia's overseas-born residents comprised 4.6 million people, 23% of the total estimated resident population (19.6 million).
- From 30 June 2001 to 30 June 2002, the number of overseas-born residents increased by 1.9%. This is slightly higher than the rate of growth in the total population, which was 1.2% over the same period.
- At 30 June 2002, 7.5% of the Australian population had been born in North-West Europe. Most of these people (5.7% of the Australian population) were born in the United Kingdom. People born in the three Asian regions (South-East Asia, North-East Asia and South and Central Asia) together comprised 5.7% of Australia's population.
- Although 63% of the overseas-born population at 30 June 2001 lived in either New South Wales or Victoria, Western Australia had the highest proportion of overseas-born residents in its population (29%). Tasmania had the lowest proportion (11%), and the Northern Territory the second lowest (16%).
INTERSTATE MIGRATION
- The number of interstate moves increased by 3.7%, from 384,100 in 2001-02 to 398,500 in 2002-03.
- Queensland, Tasmania and Victoria experienced a net gain from interstate migration during 2002-03. Queensland's gain of 39,200 persons was an increase of 26% over the preceding year. Net interstate migration for Tasmania was the first net gain in that state for over ten years.
- New South Wales had the largest net interstate migration outflow in 2002-03 (-31,800 people). The second highest net outflow was from Northern Territory (-3,400).
- In 2002-03, the median age of interstate migrants was 29 years. The Australian Capital Territory and the Northern Territory received the youngest interstate migrants (both with a median age of 27 years). Tasmania received the oldest interstate migrants (median age 32 years).
MIGRATION AND POPULATION GROWTH
Over the past two decades, Australia's level of NOM has fluctuated substantially. The peak of 157,400 people in 1988-89 resulted in NOM being the main contributor to Australia's population growth in that year (56%), while the trough of 30,000 people in 1992-93 contributed only 17% to population growth. NOM has fluctuated since then but has been above 100,000 since 1999-2000 and has contributed around half of population growth each year since 2000-01.
COMPONENTS OF POPULATION GROWTH
OVERSEAS MOVEMENT AND NET OVERSEAS MIGRATION
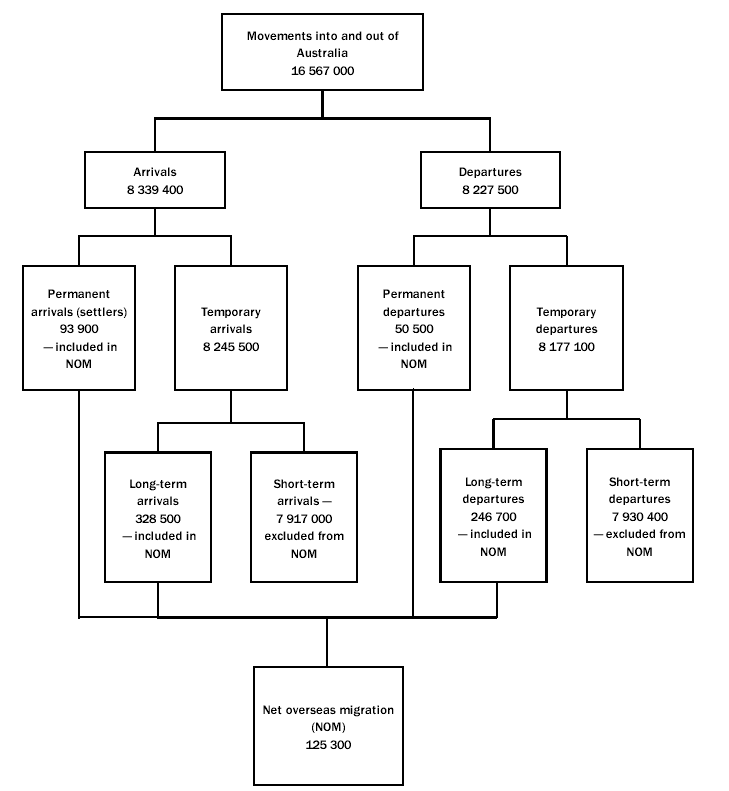
Most overseas movements into and out of Australia are short-term. In 2002-03 there were 8.3 million arrivals, of which 7.9 million (95%) were short-term, 328,500 (4%) were long-term and 93,900 (1%) were permanent (settler) arrivals. In the same year, there were 8.2 million departures, of which 246,700 (3%) were long-term and 50,500 (1%) were permanent departures. Of all movements, the proportion which have been long-term or permanent (and have therefore contributed to NOM and ERP) has been under 6% each year from 1982-83 to 2002-03.
COMPONENTS OF ALL OVERSEAS MOVEMENTS - 2002-03p

AGE AND SEX
The impact of NOM on the age structure of the resident population in Australia is to contribute a larger proportion of 15-29 year olds, although there is little impact on the proportion of males and females. In 2002-03, the proportion of NOM in the 15-29 year group was 62%, compared with 21% of ERP. Those travellers aged 0-14 years comprised 15% of NOM compared with 20% of ERP, and those aged 30 years and over comprised 24% of NOM and 59% of ERP. The sex ratio for NOM was 94 males per 100 females, lower than that for ERP in 2002-03 (99 males per 100 females).
AGE AND SEX PROFILE OF NOM AND ERP - 2002-03p
INTERSTATE POPULATION FLOWS
Queensland continued to be the most popular destination for Australians moving interstate, receiving the largest number of arrivals during 2002-03 (120,200). New South Wales and Victoria followed with 93,400 and 74,200 arrivals respectively.
Over half of Queensland arrivals during 2002-03 came from New South Wales (53%), followed by Victoria (21%), Western Australia (7%) and South Australia (6%). New South Wales arrivals most commonly came from Queensland (41%), Victoria (26%) and the Australian Capital Territory (12%). Migrants to Victoria came mostly from New South Wales (37%), Queensland (27%), South Australia (12%) and Western Australia (11%), while Western Australia's arrivals were from New South Wales (27%), Victoria (24%), Queensland (22%) and South Australia (11%).
INTERSTATE MOVERS 2002-03
| | State or territory of departure
|  |
| State or territory of arrival | NSW | Vic. | Qld | SA | WA | Tas. | NT | ACT | Total arrivals |
|  |  |  |  |  |  |  |  |  |
| NSW | . . | 24,190 | 37,957 | 6,670 | 7,817 | 2,615 | 2,755 | 11,401 | 93,405 |
| Vic. | 27,570 | . . | 19,675 | 9,075 | 8,329 | 4,339 | 2,498 | 2,718 | 74,204 |
| Qld | 63,921 | 25,272 | . . | 7,683 | 8,938 | 4,063 | 6,274 | 4,095 | 120,246 |
| SA | 7,557 | 8,332 | 5,719 | . . | 3,436 | 949 | 3,028 | 835 | 29,856 |
| WA | 8,343 | 7,389 | 6,900 | 3,373 | . . | 1,419 | 2,623 | 851 | 30,898 |
| Tas. | 4,226 | 4,362 | 3,710 | 1,152 | 1,737 | . . | 406 | 413 | 16,006 |
| NT | 2,506 | 2,275 | 4,255 | 2,493 | 2,444 | 371 | . . | 413 | 14,757 |
| ACT | 11,072 | 2,356 | 2,823 | 907 | 1,007 | 355 | 562 | . . | 19,082 |
|  |  |  |  |  |  |  |  |  |
| Total Departures | -31,790 | 28 | 39,207 | -1,497 | -2,810 | 1,895 | -3,389 | -1,644 | , , |
|
THE OVERSEAS-BORN POPULATION
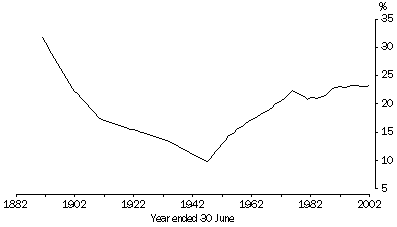
An important effect of migration into Australia is the impact on ethnic diversity caused by residents born overseas. At 30 June 2002, the estimated resident population of Australia was 19.6 million, an increase of 1.2% since 30 June 2001 and an average annual increase of 1.2% since 30 June 1997. An estimated 23% of Australia's resident population was born overseas, the same as at 30 June 2001 and continuing the historical trend of a high proportion of overseas-born among Australia's population. Those born in the United Kingdom were the largest group of overseas-born, followed by New Zealand, Italy, Viet Nam and China.
High levels of immigration to Australia in the years before the 1891 Census resulted in 32% of the population enumerated in 1891 as born overseas. At the 1901 Census this proportion had fallen to 23%, the same as the current level. The proportion fell to a low of 10% in 1947, and then rose rapidly in response to high post-war migration.
POPULATION BORN OVERSEAS(a)

(a) Census years only until 1981. Annual population estimates as at 30 June by country of birth from 1981 onwards.
For further information:
Main Features:
Australian Demographic Statistics, 3101.0
Overseas Arrivals and Departures 3401.0
International Migration
Feature Article: Population Mobility
Special Article: Long-Term Movement
Time Series Spreadsheets (cost involved):
Interstate Arrivals
Interstate Departures
Total Movement, Arrivals - Category of Movement
Total Movement, Departures - Category of Movement
Permanent Movement, Settlers - Country of Birth (Major Groups)
Permanent Movement, Settlers - Country of Birth
Publications (cost involved):
Australian Demographic Statistics, 3101.0
Overseas Arrivals and Departures 3401.0
Statistical Concepts Library:
Demographic Estimates and Projections: Concepts, Sources and Methods
Catalogue:
Migration, Australia (cat. no. 3412.0)
Data Cubes (cost involved):
Australian Historical Population Statistics - Migration
|
 Print Page
 Print All