ABOUT THIS PUBLICATION
This publication presents information on persons in custody and community-based corrections. The statistics are derived from information provided to the Australian Bureau of Statistics (ABS) from administrative records held by corrective services agencies in each state and territory, and from the Australian Government Attorney-General's Department for details on federal prisoners. Details are provided for each state and territory on: numbers and imprisonment rates by type of custody (i.e. open or secure custody or periodic detention); prisoner numbers by legal status (sentenced or unsentenced) for all prisoners and for Indigenous prisoners; the number of sentenced receptions into custody; the number of federal prisoners; and the numbers and rates of persons serving community-based corrections orders.
The ABS acknowledges the valuable contribution of the Board of Management and the Advisory Group of the National Corrective Services Statistics Unit as well as the staff of the various agencies that provide the statistics that are presented in this publication.
FURTHER INFORMATION
More information about ABS activities in the field of crime and justice statistics is available from the Crime and Justice theme page on the ABS web site <www.abs.gov.au>. Details of other ABS publications relating to Crime and Justice statistics can be found in paragraphs 40-41 of the Explanatory Notes.
INQUIRIES
For further information about these and related statistics, contact the National Information and Referral Service on 1300 135 070 or Marika Woodberry on Melbourne (03) 9615 7601.
SUMMARY OF FINDINGS
PERSONS IN CORRECTIVE SERVICES
Based on first day of the month data, for the September quarter 2005 there were 79,202 persons under the authority of corrective services, an increase of 6% (4,251 persons) since the September quarter 2004. This total excluded those in periodic detention. The largest proportional increase was in South Australia (14%), followed by Tasmania and the Northern Territory (both 8%). The total comprised 24,296 persons in full-time custody and 54,906 persons in community-based corrections.
NUMBER OF PRISONERS
PERSONS IN PRISON CUSTODY, Average daily number per month
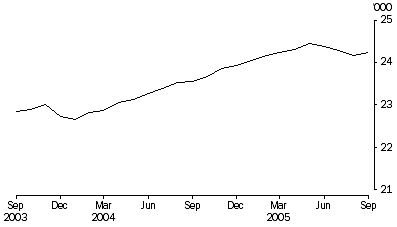
The average daily number of full-time prisoners in Australia in the September quarter 2005 was 24,226, a decrease of less than 1% on the June quarter 2005 and an increase of 3% on the September quarter 2004.
RATES PER 100,000 ADULTS
AVERAGE DAILY IMPRISONMENT RATE (a), By State and Territory
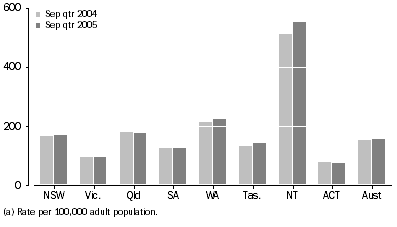
Nationally, the average daily imprisonment rate was 155 prisoners per 100,000 adult population during the September quarter 2005, an increase of 2% since the September quarter 2004 (153 prisoners). The Northern Territory had the highest imprisonment rate (550 prisoners per 100,000 adult population), followed by Western Australia (223) and Queensland (177). The Australian Capital Territory (including Australian Capital Territory prisoners held in New South Wales prisons) and Victoria had the lowest imprisonment rates (76 and 94 prisoners per 100,000 adults respectively).
The largest proportional increases in imprisonment rates since the September quarter 2004 were recorded in Tasmania and the Northern Territory (8%). The largest proportional decrease (4%) over the same period was recorded in the Australian Capital Territory.
SEX
Of the average daily number of full-time prisoners in Australia in the September quarter 2005, 22,602 (93%) were male and 1,624 (7%) were female. The average daily imprisonment rate for males was 294 prisoners per 100,000 adult male population, while for females it was 21 prisoners per 100,000 adult female population. Males were 14 times more likely to be in prison than females.
TYPE OF FULL-TIME CUSTODY
The average daily number of prisoners in secure prison custody in the September quarter 2005 was 18,266 (75% of prisoners in full-time custody). Open prison custody comprised 5,959 prisoners.
In the September quarter 2005, all prisoners held in full-time custody in the Australian Capital Territory were in secure custody. Of the other states and territories, Victoria had the highest proportion of prisoners in secure custody (89%), followed by South Australia (88%). New South Wales (including Australian Capital Territory prisoners held in New South Wales prisons) had the lowest proportion of prisoners in secure full-time custody (62%).
LEGAL STATUS
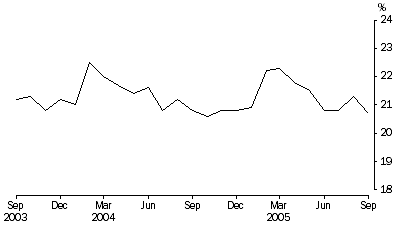
The average number of prisoners in full-time custody on the first day of each month in the September quarter 2005 was 24,296, comprising an average of 5,087 (21%) unsentenced and 19,209 sentenced (79%) prisoners. The Australian Capital Territory (including Australian Capital Territory prisoners held in New South Wales prisons) and South Australia had the highest proportions of unsentenced prisoners (at 34% each). The lowest proportions of unsentenced prisoners were recorded in Western Australia and Northern Territory (both 16%).
PERSONS IN PRISON CUSTODY, Proportion unsentenced per month
SENTENCED PRISONER RECEPTIONS
There were 5,916 sentenced prisoner receptions into full-time custody in Australia in the September quarter 2005. The number of sentenced receptions has decreased by 435 (7%) since the June quarter 2005, and by 196 (3%) since the September quarter 2004.
INDIGENOUS PRISONERS
INDIGENOUS PERSONS IMPRISONMENT RATE (a)
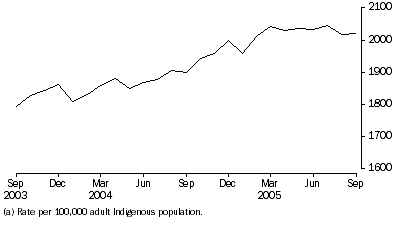
In the September quarter 2005 there were 5,670 Indigenous adult prisoners in full-time custody in Australia, comprising 5,203 (92%) males and 467 (8%) females. Almost 80% of the total Indigenous prisoner population was located in three states: New South Wales (1,732 persons); Western Australia (1,375); and Queensland (1,354).
The national rate of imprisonment for Indigenous people in the September quarter 2005 was 2,027 per 100,000 adult Indigenous population, an increase of 7% since the September quarter 2004 and a decrease of less than 1% since the June quarter 2005.
The highest rate of imprisonment for Indigenous prisoners was recorded in Western Australia (3,421 Indigenous prisoners per 100,000 adult Indigenous population), followed by New South Wales (2,176).
INDIGENOUS IMPRISONMENT RATE (a), By State and Territory
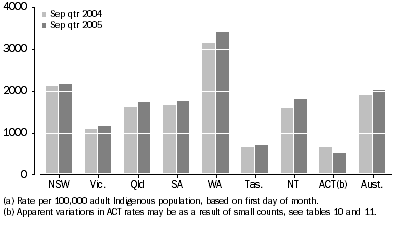
The largest proportional increase (13%) in the rate of imprisonment of Indigenous people since the September quarter 2004 was recorded in the Northern Territory. The next highest increase was in Western Australia (9%), followed by Queensland (8%).
The age standardised national rate of imprisonment of Indigenous people from the National Prisoner Census at June 2004 was 11 times higher (1,417) than the rate for non-Indigenous people (129). Imprisonment rates in the National Prisoner Census take into account the different age profiles of the Indigenous and non-Indigenous populations. Further information on the comparison of imprisonment rates between Indigenous and non-Indigenous populations can be found in Prisoners in Australia 2004 (cat. no. 4517.0).
PERIODIC DETENTION
Periodic detention is a form of custody only used in New South Wales and the Australian Capital Territory. During the September quarter 2005 there was an average daily number of 854 persons in New South Wales and 102 persons in the Australian Capital Territory held in periodic detention. The rate of imprisonment for periodic detention increased in New South Wales by 12% and in the Australian Capital Territory by 3% between the September quarters 2004 and 2005.
FEDERAL PRISONERS
In the September quarter 2005, there were 663 federal prisoners in Australia, a decrease of 16 (2%) since the September quarter 2004. More than half (57%) of these federal prisoners were sentenced in New South Wales.
PERSONS IN COMMUNITY-BASED CORRECTIONS
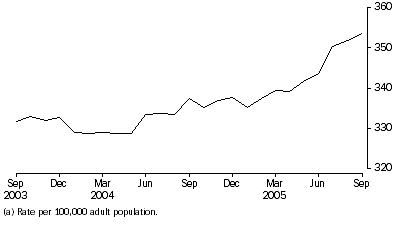
Community-based corrections orders are non-custodial orders under the authority of corrective services and include restricted movement, fine option, community service, parole, bail and sentenced probation. In the September quarter 2005, there were 54,906 persons in community-based corrections in Australia, an increase of 3% (1,852 persons) since the June quarter 2005 and 7% (3,411 persons) since the September quarter 2004.
Rates per 100,000 adults
Nationally, the rate of persons in community-based corrections was 352 persons per 100,000 adult population for the September quarter 2005. This was an increase of 5% since the September quarter 2004 (335 persons per 100,000 adults). The largest increases since the September quarter 2004 were recorded in South Australia (16%), followed by New South Wales and the Australian Capital Territory (both 7%).
COMMUNITY-BASED CORRECTIONS RATE (a)
 COMMUNITY-BASED CORRECTIONS RATE (a), By State and Territory
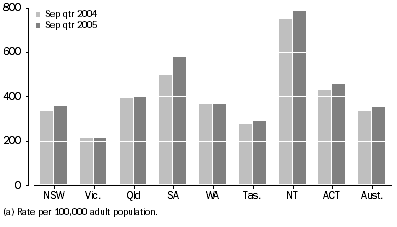
In the September quarter 2005, the rate of community-based corrections for males was 583 per 100,000 adult male population compared to 125 females per 100,000 adult female population. Males were almost five times more likely to be in community-based corrections than females.
Type of orders
In the September quarter 2005, there were 9,458 persons serving parole orders following a period of imprisonment. More than three quarters (76%) of the total persons serving parole orders were located in three states: New South Wales (4,232 persons); Victoria (1,635); and Western Australia (1,343).
 Print Page
 Print All