MARCH KEY FIGURES
 |  | Feb 2011 | Mar 2011 | Feb 11 to Mar 11 | Mar 10 to Mar 11 |
|
| Trend |  |  |  |  |  |  |
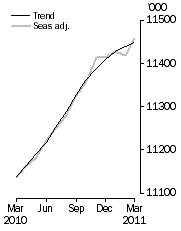
 | Employed persons ('000) | 11 439.9 | 11 448.5 | 8.6 |  | 2.8 | % |
 | Unemployed persons ('000) | 600.1 | 594.7 | -5.4 |  | -4.7 | % |
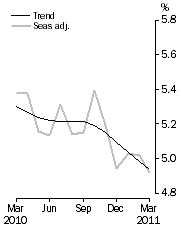
 | Unemployment rate (%) | 5.0 | 4.9 | 0.0 | pts | -0.4 | pts |
 | Participation rate (%) | 65.8 | 65.8 | 0.0 | pts | 0.5 | pts |
| Seasonally Adjusted |  |  |  |  |  |  |
 | Employed persons ('000) | 11 419.3 | 11 457.1 | 37.8 |  | 2.9 | % |
 | Unemployed persons ('000) | 603.1 | 592.9 | -10.2 |  | -6.3 | % |
 | Unemployment rate (%) | 5.0 | 4.9 | -0.1 | pts | -0.5 | pts |
 | Participation rate (%) | 65.7 | 65.8 | 0.1 | pts | 0.5 | pts |
|
Employed Persons

| Unemployment Rate

|
MARCH KEY POINTS
TREND ESTIMATES (MONTHLY CHANGE)
- Employment increased to 11,448,500.
- Unemployment decreased to 594,700.
- Unemployment rate decreased to 4.9%.
- Participation rate at 65.8%.
- Aggregate monthly hours worked increased to 1,609.7 million hours.
SEASONALLY ADJUSTED ESTIMATES (MONTHLY CHANGE)
- Employment increased 37,800 (0.3%) to 11,457,100. Full-time employment increased 32,100 to 8,105,600 and part-time employment increased 5,700 to 3,351,500.
- Unemployment decreased 10,200 (-1.7%) to 592,900. The number of persons looking for full-time work decreased 3,100 to 414,600 and the number of persons looking for part-time work decreased 7,100 to 178,300.
- Unemployment rate decreased to 4.9%. The male unemployment rate decreased 0.3 pts to 4.5% and the female unemployment rate increased 0.1 pts to 5.4%.
- Participation rate increased 0.1 pts to 65.8%.
- Aggregate monthly hours worked increased 13.1 million hours to 1,618.3 million hours.
NOTES
FORTHCOMING ISSUES
| ISSUE | Release Date |
| April 2011 | 12 May 2011 |
| May 2011 | 9 June 2011 |
| June 2011 | 7 July 2011 |
| July 2011 | 11 August 2011 |
| August 2011 | 8 September 2011 |
| September 2011 | 13 October 2011 |
SAMPLING ERROR
The estimates in this publication are based on a sample survey. Published estimates and the movements derived from them are subject to sampling variability. Standard errors give a measure of this variability (see pages 34 and 35 of the publication). The interval bounded by two standard errors is the 95% confidence interval, which provides a way of looking at the variability inherent in estimates. This represents a 95% chance that the true value of the estimate lies within that interval.
Movements in seasonally adjusted series between
February 2011 and March 2011 |
|
 | Monthly change | 95% Confidence interval |
 |  |  |  |  |
|
| Total Employment | 37 800 | -16 800 | to | 92 400 |
| Total Unemployment | -10 200 | -43 200 | to | 22 800 |
| Unemployment rate | -0.1 pts | -0.3 pts | to | 0.1 pts |
| Participation rate | 0.1 pts | -0.3 pts | to | 0.5 pts |
|
INQUIRIES
For further information about these and related statistics, contact the National Information and Referral Service on 1300 135 070, email client.services@abs.gov.au or Labour Force on Canberra (02) 6252 6525, email labourforce@abs.gov.au.
 Quality Declaration
  Print Page
 Print All