NOTES
OVERVIEW
This is the final issue of this electronic product. It is intended that future state and territory-specific data will be made available in spreadsheet format with releases of the relevant annual national publications.
This electronic product provides a demographic overview of Tasmania, 2004. It contains summary tables and commentary on trends in the components of population change including births, deaths and migration. Marriages, divorces, estimated resident population and various demographic rates are also presented. Population and migration data are for the year ended 30 June 2004, while births, deaths, marriages and divorces data are for the year ended 31 December 2004. More recent data are released quarterly in Australian Demographic Statistics (cat. no. 3101.0).
For comparisons between the states and territories of Australia, please refer to Demography, Australia, 2004 (cat. no. 3311.0.55.001). Demography publications for each state and territory can be accessed from the Related Information tab at the top of this page. Additional state demographic data are also available from publications and data cubes linked at the top of this page. The Demography Theme Page provides links to other Australian as well as international demographic statistics. The National Regional Profiles provide economic and social statistics of Statistical Local Areas and Local Government Areas of Australia.
INQUIRIES
For further information about these and related statistics, contact the National Information and Referral Service on 1300 135 070 or Keith Churchill on Hobart (03) 6222 5832.
SUMMARY COMMENTARY
POPULATION
At 30 June 2004 the Tasmanian resident population was estimated to have reached 482,200 persons (238,000 males and 244,200 females). Tasmania's resident population represented 2.4% of Australia's resident population.
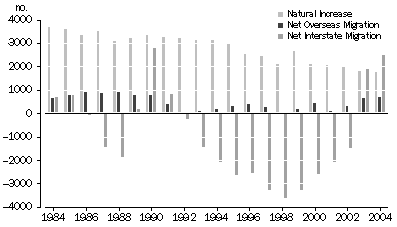
The resident population increase of 4,900 during 2003-04 was composed of a natural increase of 1,800 persons, net overseas migration gain of 700 persons, and a net interstate migration gain of 2,500 persons.
POPULATION COMPONENTS, Tasmania - 1984-2004

The annual population growth rate in Tasmania in 2003-04 was 1.0%, marginally lower than the national level (1.1%). Historically, Tasmania's population growth mirrored national levels during the 1950s but generally slipped to lower levels thereafter.
Within Tasmania in 2003-04, all Statistical Divisions grew in population. Greater Hobart increased by 2,300 persons (1.1%), Northern by 1,500 persons (1.1%), Southern by 430 persons (1.2%), and Mersey-Lyell by 720 persons (0.7%).
At Local Government Area (LGA) level, 24 of Tasmania's 29 municipalities experienced population growth in 2003-04. Launceston, the state's largest municipality, had the largest growth (680 persons), followed by three southern municipalities, Kingborough (640 persons), Hobart (480 persons) and Clarence (410 persons). Municipalities experiencing the fastest growth were Brighton (2.8%), Glamorgan/Spring Bay (2.7%), Kentish (2.6%) and Latrobe (2.3%). The Derwent Valley had the state's largest population decline of -330 persons.
Persons aged under 15 years comprised 20.1% of the Tasmanian population at 30 June 2004, compared with 22.6% in 1994 and 24.8% in 1984.
Conversely, the proportion of the Tasmanian population aged 65 years and over has increased from 10.5% at 30 June 1984 to 12.4% in 1994 to 14.3% in 2004. The proportion of persons aged 85 years and over increased from 1.0% in 1994 to 1.6% in 2004. Females comprised 55.3% of persons aged 65 years and over and 69.7% of persons aged 85 years and over at 30 June 2004.
POPULATION AND HOUSEHOLDS, Tasmania - Selected years at 30 June |
|  |
 |  |  | 1994 | 2003 | 2004 |  |
|  |
| Estimated resident population | ('000) | 472.9 | 477.3 | 482.2 |  |
| Components of population change(a) |  |  |  |  |  |
 | Natural increase(b) | no. | 3 116 | 1 784 | 1 756 |  |
 | Net overseas migration | no. | 192 | 1 014 | 700 |  |
 | Net interstate migration | no. | -2 107 | 1 895 | 2 475 |  |
| Total increase(a)(c) | no. | 1 280 | 4 693 | 4 931 |  |
| Annual growth rate(a) | % | 0.27 | 0.99 | 1.03 |  |
| Estimated resident households(d) | ('000) | 181.3 | nya | nya |  |
| Projected households(e) | ('000) | . . | 196.1 | 198.3 |  |
|  |
| . . not applicable |
| nya not yet available |
| (a) From 30 June previous year. |
| (b) Excess of births over deaths. Births and deaths figures used to compile natural increase for population estimates are based on year of occurrence and may differ from births and deaths data based on year of registration displayed in the Births and Deaths sections of this paper. |
| (c) Includes intercensal discrepancy not accounted for by natural increase and net migration. |
| (d) Based on 1996 census data. |
| (e) Series II from Household and Family Projections, Australia, 2001-2026 (Cat. no. 3236.0). |
BIRTHS AND CONFINEMENTS
In 2004 there were 5,700 confinements resulting in 5,800 live births registered to mothers usually resident in Tasmania. There were 110 confinements which resulted in a multiple birth.
Birth registrations were similar to those recorded in 2003 and 15.1% lower than in 1994 (6,800). Nationally, births in 2004 were 1.2% higher than in 2003, and were 1.5% lower than in 1994. There were 3,000 male births and 2,800 female births registered in Tasmania in 2004, resulting in a sex ratio of 108.4 males per 100 females.
There were 3,000 nuptial confinements and 2,700 exnuptial confinements in Tasmania in 2004. Exnuptial births represented 47.6% of all births, similar to the 2003 proportion (47.1%). In 1994 exnuptial births accounted for 31.9% of all Tasmanian births, and in 1984 only 15.2%.
Indigenous births are defined as births in which one or both parents identified as being of Aboriginal or Torres Strait Islander origin. In 2004 there were 360 Indigenous births registered to parents who were usually resident in Tasmania representing 6.1% of all births.
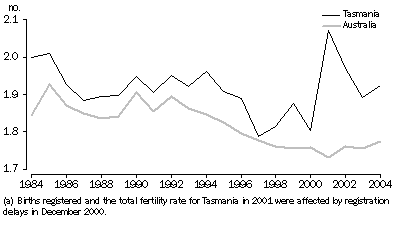
Tasmania's total fertility rate (TFR) (the average number of children a female would bear during her lifetime based on current age-specific fertility rates) in 2004 was 1.93, significantly above the Australian rate of 1.77. Since 1975, TFRs have been below the rate of 2.1 babies per woman which is the rate required for natural replacement of the population.
TOTAL FERTILITY RATES(a), Australia and Tasmania - 1984-2004

The Tasmanian net reproduction rate (the average number of daughters a woman would bear during her reproductive lifetime if she was subject to current female age-specific fertility rates and to prevailing mortality rates) in 2004 was 0.91, below the replacement level of one.
The upward trend towards parents having children later in life continued in 2004. The median age of Tasmanian mothers was 30.9 years and fathers 33.1 years. The 25-29 year age group has had the highest age-specific fertility rate of 122.4 babies per 1,000 women in 2004. The 30-34 year age group with 104.9 children per 1,000 women was the next most fertile age group, followed by the 20-24 year age group with 76.2 children per 1,000 women. Twenty years ago in Tasmania, the 25-29 year age group was also the most fertile with 148.2 children per 1,000 women followed by the 20-24 year age group (116.4) and 30-34 year age group (74.8).
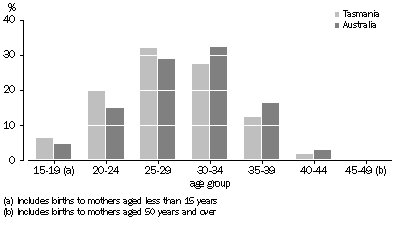
Nationally, the most fertile age group in 2004 was the 30-34 year age group (114.4 children per 1,000 women) followed by the 25-29 year age group (102.5). The 30-34 year age group became the most fertile group in 2000. The percentage contribution of age-specific fertility rates to the total fertility rate (or the distribution of births by age group of mother) in 2004 for both Tasmania and Australia is shown in the following graph.
CONTRIBUTION OF AGE-SPECIFIC FERTILITY RATES TO TOTAL FERTILITY RATE, Australia and Tasmania - 2004

BIRTHS AND CONFINEMENTS, Tasmania - Selected years(a) |
|  |
 |  |  | 1994 | 2003 | 2004 |  |
|  |
| Live births |  |  |  |  |  |
 | Number | no. | 6 844 | 5 752 | 5 809 |  |
 | Crude birth rate(b) | rate | 14.5 | 12.1 | 12.0 |  |
 | Total fertility rate(c) | rate | 1.950 | 1.898 | 1.927 |  |
 | Net reproduction rate(d) | rate | 0.941 | 0.902 | 0.913 |  |
| All confinements |  |  |  |  |  |
 | Number | no. | 6 768 | 5 663 | 5 702 |  |
 | Median age of mother | years | 28.1 | 29.3 | 29.2 |  |
| Nuptial confinements |  |  |  |  |  |
 | Number | no. | 4 661 | 3 042 | 3 043 |  |
 | Median age of mother | years | 29.3 | 31.0 | 30.9 |  |
 | Median age of father | years | 31.7 | 33.2 | 33.1 |  |
| First nuptial confinements |  |  |  |  |  |
 | Number | no. | 2 022 | 1 198 | 1 264 |  |
 | Median age of mother | years | 28.0 | 29.9 | 29.7 |  |
|  |
| (a) Year of registration. |
| (b) Births per 1,000 population. |
| (c) Births per woman. |
| (d) Daughters surviving to reproductive age per woman. |
DEATHS
In 2004 there were 3,900 registered deaths of persons usually resident in Tasmania, less than the number of deaths registered in 2003 (4,000) and the same number of deaths as in 1994. There were 2,000 male deaths and 1,900 female deaths, resulting in a sex ratio of 107.7 male deaths per 100 female deaths, lower than the national sex ratio of 106.7 male deaths per female deaths.
The crude death rate (CDR) decreased from 8.3 deaths per 1,000 population in 1994, to 8.1 deaths per 1,000 population in 2004 and was marginally lower than the 8.3 deaths per 1,000 population in 2003. The standardised death rate (SDR), which eliminates the effect of the changing age structure of population over time by relating all deaths to a standard 2001 Australian population, decreased over the same time period. In 2004 the SDR for Tasmania was 7.1 deaths per 1,000 population, falling from 9.1 deaths per 1,000 population in 1994.
While CDRs for males have been slightly higher than those for females in Tasmania over the past decade, SDRs reveal that rates for males have remained substantially higher in proportion to female rates. In 2004 the male SDR was 8.9 deaths per 1,000 standard population (10.0 in 1994) compared to the female SDR of 5.7 per 1,000 standard population (5.7 in 1994).
The life expectancy at birth in 2004 (based on the 2002-2004 age specific death experience) for Tasmanian usual residents was 76.7 years for males and 81.8 years for females, similar to that experienced in 2003. Tasmania's life expectancy at birth remains below the national figure by 1.4 years for males and 1.2 years for females. Compared to 10 years ago, Tasmania's life expectancy at birth improved by 3.5 years for males and 2.0 years for females.
DEATHS, Tasmania - Selected years(a) |
|  |
 |  |  | 1994 | 2003 | 2004 |  |
|  |
| Number | no. | 3 911 | 3 965 | 3 892 |  |
| Crude death rate(b) | rate | 8.3 | 8.3 | 8.1 |  |
| Standardised death rate(c) | rate | 9.1 | 7.4 | 7.1 |  |
| Median age at death |  |  |  |  |  |
 | Males | years | 74.0 | 75.9 | 76.5 |  |
 | Females | years | 79.3 | 82.1 | 82.5 |  |
| Infant deaths |  |  |  |  |  |
 | Number | no. | 51 | 40 | 21 |  |
 | Infant mortality rate(d) | rate | 7.5 | 7.0 | 3.6 |  |
| Life expectancy at birth(e) |  |  |  |  |  |
 | Males | years | 73.2 | 76.6 | 76.7 |  |
 | Females | years | 79.9 | 81.4 | 81.8 |  |
|  |
| (a) Year of registration. |
| (b) Deaths per 1,000 population. |
| (c) Deaths per 1,000 population. Standardised death rates use total persons in the 2001 Australian population as the standard population. |
| (d) Deaths per 1,000 live births. |
| (e) From 1995 onwards expectation of life has been calculated using three years of data. |
MIGRATION
For the year ending 30 June 2004, more people migrated to Tasmania from overseas than left the state with an intention of staying overseas for a period of 12 months or more. Net overseas migration added 700 persons to the Tasmanian population during 2003-04, a decrease from the net increase of 1,000 persons in 2002-03, but above the previous nine years, which averaged a net increase of 250 persons. There were 3,400 arrivals from overseas and 2,300 departures for destinations outside Australia. During the 1990s, annual overseas arrivals to Tasmania remained around the 2,000 person level, which means the last two years' arrivals represent a substantial increase on previous years.
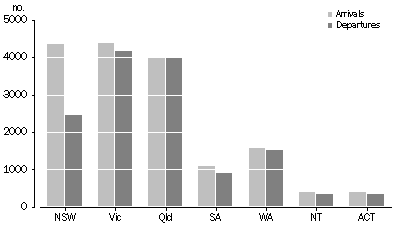
Tasmanian net interstate migration in the year ending 30 June 2004 also made a positive contribution of 2,500 persons to population growth. Of the 16,200 persons who changed their usual residence from interstate to Tasmania (arrivals), 4,400 persons (27.1%) came from Victoria, 4,300 persons (26.8%) from New South Wales, and 4,000 persons (24.6%) from Queensland. The destination of 13,700 Tasmanians moving elsewhere within Australia included 4,200 persons (30.4%) moving to Victoria, 4,000 persons (29.1%) to Queensland, 2,400 persons (17.8%) to New South Wales and 1,500 persons (11.1%) to Western Australia.
Tasmania gained population from each state and territory with one exception, Queensland, where 15 more Tasmanians left for Queensland than Queenslanders arrived in Tasmania in the year ending 30 June 2004. By far the largest net increase in the Tasmanian population was from New South Wales with 1,900 persons. Net movers from Victoria (212 persons) and South Australia (210 persons) were also sources of population growth.
INTERSTATE MIGRATION MOVEMENTS, Tasmania - at 30 June 2004

MARRIAGES
There were 2,600 marriages registered in Tasmania in 2004, a similar number to the previous year, and an 8.3% decline from the number of marriages registered in 1994 (2,900). The crude marriage rate in Tasmania in 2004 was 5.5 marriages per 1,000 population, the same as the national rate.
The long-term trend towards marrying at older ages continued in Tasmania in 2004. The median age at marriage for brides in 2004 was 30.6 years, and for bridegrooms 33.0 years. Over the last decade the median age for brides has increased by 4.4 years and by 4.2 years for grooms. Nationally in 2004, the median age of brides was 29.2 years and for bridegrooms 31.5 years.
In Tasmania in 2004 there were 1,600 registered marriages (58.6%) where neither party had been previously married. There were 560 marriages (21.1%) in which one party had been previously married, and 540 (20.3%) in which both parties were remarrying. Nationally, over two thirds of marriages involved parties never previously married, and lower proportions where one party (18.0%) or both parties (14.8%) had previously married.
Tasmania had the second highest proportion of couples cohabiting prior to marriage (83.4%) in 2004; the Northern Territory having the highest proportion (85.2%). Nationally, the figure was 75.5% with New South Wales having the lowest proportion at 69.8%.
Civil celebrants continued to perform an increasing proportion of marriages in 2004, accounting for 1,700 or almost two thirds of Tasmanian marriages. In 1994, only 47.1% of Tasmanian marriages were performed by civil celebrants. Nationally, civil celebrants performed 58.7% of marriages in 2004.
MARRIAGES, Tasmania - Selected years |
|  |
 |  |  | 1994 | 2003 | 2004 |  |
|  |
| Number registered | no. | 2 887 | 2 599 | 2 648 |  |
| Crude marriage rate(a) | rate | 6.1 | 5.4 | 5.5 |  |
| Median age at marriage |  |  |  |  |  |
 | Bridegroom | years | 28.8 | 31.8 | 33.0 |  |
 | Bride | years | 26.2 | 29.7 | 30.6 |  |
|  |
| (a) Marriages per 1,000 population. |
DIVORCES
In 2004 there were 1,400 divorces granted in Tasmania, 70 fewer than in 2003. The Tasmanian crude divorce rate in 2004 was 2.9 per 1,000 population.
The median duration of marriage in Tasmania was 14.1 years in 2004. The median interval between marriage and final separation was 10.6 years in 2004.
DIVORCES, Tasmania - Selected years |
|  |
 |  |  | 1994 | 2003 | 2004 |  |
|  |
| Number granted | no. | 1 544 | 1 336 | 1 404 |  |
| Crude divorce rate(a) | rate | 3.3 | 2.8 | 2.9 |  |
| Median duration of marriage |  |  |  |  |  |
 | To separation | years | 8.8 | 9.8 | 10.6 |  |
 | To divorce | years | 12.1 | 13.3 | 14.1 |  |
|  |
| (a) Divorces per 1,000 population. |
RELATED LINKS
Demographic data for all statistical local areas of Tasmania are available from the data cube linked on the Details tab at the top of this page.
From the Related Information Tab there are links to other releases providing more specific or in-depth analysis and information
 Print Page
 Print All