GOVERNMENT FINANCE STATISTICS
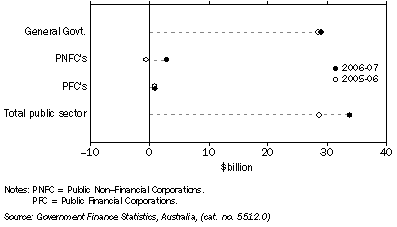
GFS NET OPERATING BALANCE, (from Table 1.7) Total public sector
- 2005-06 and 2006-07

All Australian Governments, Government finance statistics |
|  |
 | GFS Net Operating Balance | GFS Net Lending(+)/Borrowing(-) |  |
| Period | General Government | Public non-financial corporations | Public financial corporations | Total public sector | General Government | Public non-financial corporations | Public financial corporations | Total public sector |  |
Annual ($ million) |  |
|  |
| 2004-05 | 19 569 | 3 196 | 1 403 | 24 002 | 14 055 | -2 426 | 1 412 | 12 922 |  |
| 2005-06 | 28 521 | -555 | 870 | 28 694 | 19 966 | -8 997 | 839 | 11 904 |  |
| 2006-07 | 29 002 | 2 940 | 954 | 33 805 | 16 804 | -8 512 | 792 | 10 037 |  |
|  |
| Source: Government Finance Statistics, Australia, (cat. no. 5512.0) and Public Finance Section. |
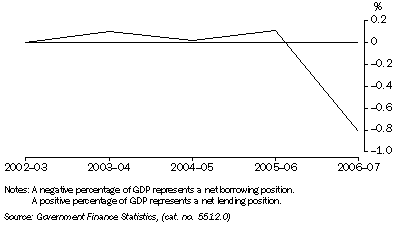
Total public sector, (from Table 1.7) Net lending/borrowing as a percentage of GDP

All Australian Governments, Government finance statistics balance sheet - as at 30 June 2007 |
|  |
 | General Government | Public non-financial corporations | Public financial corporations | Total Public Sector |  |
 | 2005-06 | 2006-07 | 2005-06 | 2006-07 | 2005-06 | 2006-07 | 2005-06 | 2006-07 |  |
($ million) |  |
|  |
| Total assets | 989 209 | 1 076 642 | 284 165 | 279 520 | 254 136 | 296 788 | 1 172 259 | 1 285 653 |  |
| Total liabilities | 364 102 | 367 914 | 102 480 | 96 521 | 233 610 | 275 802 | 558 393 | 576 923 |  |
| Shares and other contributed capital | 0 | 0 | 214 996 | 182 998 | 20 526 | 20 986 | 22 070 | 0 |  |
| GFS Net worth | 625 107 | 708 729 | -33 311 | 1 | 0 | 0 | 591 796 | 708 730 |  |
| Net debt | -49 441 | -66 558 | 50 200 | 45 834 | -40 306 | -40 430 | -39 547 | -61 154 |  |
|  |
| Source: Government Finance Statistics, Australia, (cat. no. 5512.0) and Public Finance Section. |