ABOUT THIS PUBLICATION
This publication presents statistics relating to vehicles which were registered at 31 March 2004 with a motor vehicle registration authority. Motor vehicle registration statistics are compiled from data made available by various state and territory motor vehicle registration authorities and reflect the information as recorded in registration documents.
Estimates of the size and composition of the vehicle fleet were first published in 1921. However, it is only since 1971 that a Motor Vehicle Census (MVC) has been conducted on a more regular basis. The MVC has not been conducted in each and every year since 1971 and the census dates have varied over those years. Therefore, care should be taken when attempting to compare movements over the years.
Statistics are provided on vehicle types comprising passenger vehicles, campervans, light commercial vehicles, all types of trucks, buses and motorcycles.
Vehicle characteristic information includes make of vehicle, year of manufacture, type of fuel that the vehicle was manufactured to use; and for trucks, Gross Vehicle Mass or Gross Combination Mass. The size of the motor vehicle fleet is also compared with the estimated resident population.
INQUIRIES
For further information about these and related statistics, contact the National Information and Referral Service on 1300 135 070.
SUMMARY OF FINDINGS
TOTAL NUMBER OF VEHICLES ON REGISTER
There were 13.5 million motor vehicles, including motorcycles, registered in Australia at 31 March 2004. This represents an increase of 10.3% since the 1999 Motor Vehicle Census (MVC), when there were 12.3 million vehicles registered in Australia. The average annual growth over this five year period was 2.0%.
Type of vehicle (1999-2004), Australia |
|  |
 | 1999 | 2004 | change |  |
 | no. | no. | % |  |
|  |
| Passenger vehicles | 9,686,223 | 10,629,401 | 9.7 |  |
| Light commercial vehicles | 1,721,200 | 1,952,486 | 13.4 |  |
| Rigid trucks | 346,823 | 357,617 | 3.1 |  |
| Articulated trucks | 63,295 | 66,300 | 4.7 |  |
| Non-freight carrying trucks(a) | 51,319 | 59,644 | 16.2 |  |
| Buses | 65,891 | 71,314 | 8.2 |  |
| Motorcycles | 333,782 | 396,309 | 18.7 |  |
| Total motor vehicles | 12,268,533 | 13,533,071 | 10.3 |  |
|  |
| (a) Campervans are included with non-freight carrying trucks. |
The passenger vehicle fleet has grown from 9.7 million in 1999 to 10.6 million in 2004, an increase of 9.7%. Motorcycles had the largest growth (18.7%) over the five year period, followed by non-freight carrying trucks, including campervans (16.2%), light commercial vehicles (13.4%), and buses (8.2%).
Articulated trucks rose by 4.7% to 66,300, while rigid trucks had the smallest growth over the five year period increasing by 3.1% to 357,617.
STATES AND TERRITORIES
New South Wales had the largest share of the Australian fleet with 4.1 million vehicles (30.0% of the total) registered, followed by Victoria with 3.6 million (26.3%) and Queensland with 2.7 million (19.6%). The Northern Territory had the smallest share with 0.1 million vehicles (0.8%) registered. State shares of the national fleet have remained relatively stable since 1999.
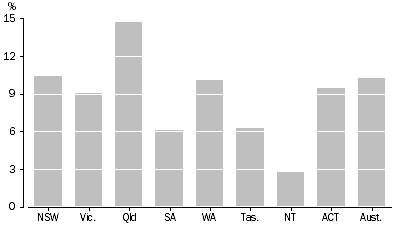
From 1999 to 2004, two states experienced growth above the national average of 10.3%. The motor vehicle fleet in Queensland showed the largest growth with a 14.7% increase since 1999, an average annual growth of 2.8%. The fleet in New South Wales increased by 10.4% over the same period, representing an average annual growth of 2.0%. The Northern Territory showed the smallest growth in fleet size since 1999. This was an increase of 2.8% in the number of vehicles registered, an average annual increase of 0.5%.
Percentage Change in motor vehicle registrations (1999-2004)
VEHICLES AND RESIDENT POPULATION
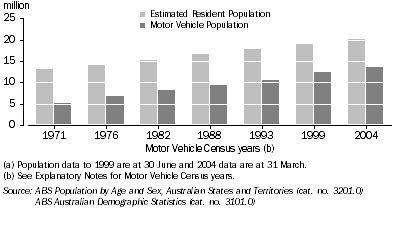
The ratio of motor vehicles registered to the estimated resident population (ERP) has been increasing consistently over the last 33 years. There were 398 vehicles per 1,000 residents in 1971 and 595 vehicles per 1,000 residents in 1993. This compares to 675 motor vehicles per 1,000 residents in Australia in 2004.
The average annual growth in the motor vehicle fleet over the 33 year period from 1971 to 2004 was 3.0%, while the ERP over the same period had an average annual growth of only 1.3%.
Motor Vehicle Fleet and Estimated Resident Population(a)
AVERAGE AGE OF THE FLEET
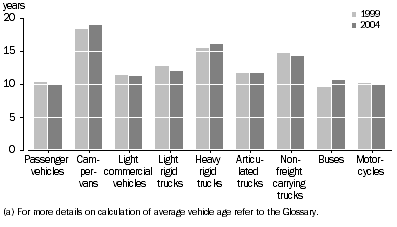
The average age of all vehicles registered in Australia at 31 March 2004 was 10.3 years. This is slightly younger than the 10.6 years recorded in the 1999 MVC. The majority of the total Australian fleet (68.6%) was manufactured after 1990.
Campervans were the oldest vehicles registered with an average age of 18.9 years, while motorcycles were the youngest vehicle type with an average age of 9.8 years.
The average age of passenger vehicles dropped from 10.3 years in 1999 to 10.0 years in 2004, with 70.3% of passenger vehicles manufactured after 1990.
Estimated Average Vehicle Age(a), Type of vehicle
Tasmania had the oldest fleet with an average age of 12.3 years and with 57.9% of vehicles manufactured after 1990. This was followed by South Australia with an average age of 11.6 years and 61.5% manufactured after 1990. The youngest fleets in Australia belonged to New South Wales and the Northern Territory, each with an average age of 9.3 years and almost three-quarters of vehicles in each fleet manufactured after 1990.
TYPE OF FUEL
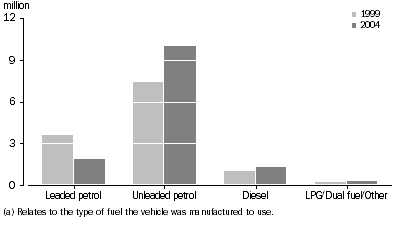
In 2004, there were 10.0 million vehicles (74.1% of the total vehicle fleet) manufactured to use unleaded petrol, while 1.9 million vehicles (13.7%) were manufactured to use leaded petrol. In contrast, in 1999, there were 7.4 million vehicles (60.1%) manufactured to use unleaded petrol and 3.6 million vehicles (29.4%) manufactured to use leaded petrol. This represents an increase of 36.2% in unleaded petrol vehicles and a decrease of 48.4% in leaded petrol vehicles since 1999.
Motor vehicle fleet, Type of fuel(a)
In 2004, the Australian Capital Territory had the highest proportion of vehicles (81.3%) manufactured to use unleaded petrol. Consistent with their older fleet, Tasmania had the highest proportion of vehicles (21.8%) manufactured to use leaded petrol.
Passenger vehicles comprised 86.7% of motor vehicles that were manufactured to use unleaded petrol and 74.8% of vehicles manufactured to use leaded petrol.
The number of vehicles manufactured to use diesel fuel made up 9.7% (or 1.3 million vehicles) of the total fleet, representing an increase of 28.9% since the 1999 MVC. Diesel vehicles were most prominent in the Northern Territory with 24.0% of the fleet manufactured to use this fuel type. The Australian Capital Territory had the smallest proportion of diesel vehicles with 4.0%.
Light commercial vehicles made up 40.9% of vehicles manufactured to use diesel fuel, while rigid and articulated trucks accounted for 23.2% and 4.9% respectively. Passenger vehicles manufactured to use diesel fuel increased by 40.9% since the 1999 MVC, and represented 24.5% of all diesel vehicles in 2004.
CHARACTERISTICS OF THE FLEET
Passenger Vehicles
Passenger vehicles accounted for 78.5% of all vehicles registered in Australia in 2004. The state/territory with the largest proportion of passenger vehicles was the Australian Capital Territory with 86.1%, while the Northern Territory had the smallest share with 65.0%.
Queensland had the highest growth with an increase of 14.1%, while the Northern Territory showed the least growth, rising by 2.0%.
A total of 5.9 million passenger vehicles were either Holden, Ford or Toyota. Respectively, these three makes accounted for 19.1%, 18.2% and 18.2% of the total passenger vehicle fleet registered at 31 March 2004.
Kia recorded the highest growth of all passenger vehicle makes since 1999, with an average annual growth of 34.0%. Other makes that recorded high average annual growths were Lexus (19.0%), Audi (12.3%), Daewoo (10.1%), Jeep (9.6%) and Proton (9.4%). These high average annual growths should be considered in terms of the low number of vehicles from which they were derived.
Other Vehicle Types
Since 1999, light commercial vehicles have grown by 13.4%, light rigid trucks by 13.6% and articulated trucks by 4.7%.
Percentage change in type of vehicle (1999-2004)
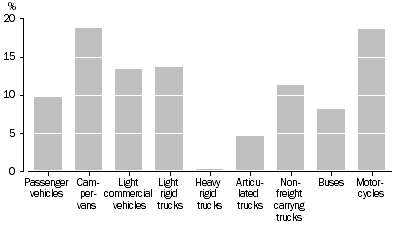
While the total number of heavy rigid trucks registered in Australia has remained relatively stable since 1999, there were variances by gross vehicle mass (GVM). The number of registrations for the heaviest rigid trucks (those with a GVM greater than 20 tonnes) has increased by 19.6% since 1999, while registrations for heavy rigid trucks with a GVM of less than 20 tonnes decreased 22.1% over the same period.
Almost half (47.7%) of articulated trucks had a gross combination mass (GCM) of between 40 and 60 tonnes. The largest growth since 2002 in the GCM of articulated trucks was in the 60 to 100 tonnes range with a 29.4% increase, while the largest decline was in the 20 to 40 tonnes range with a 14.4% decrease.
Queensland had the largest share of the heaviest articulated trucks, accounting for 55.6% of all articulated trucks registered in Australia with a GCM over 100 tonnes.
STATISTICAL DIVISIONS
For most states and territories, the capital city statistical divisions had the largest shares of their respective vehicle fleet. The exceptions to this were Queensland and Tasmania. With 2.4 million motor vehicle registrations, Melbourne and Sydney were the SDs with the largest fleets.
Total Motor Vehicles, Capital city statistical division and Balance of state
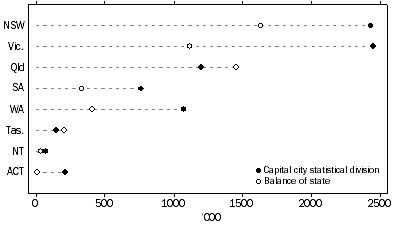
Brisbane, Darwin and Greater Hobart were the only capital city SDs where the number of passenger vehicle registrations was less than 80% of the capital city SD fleet.
Capital city SDs had the largest share of vehicles manufactured to use unleaded petrol for all states and territories. Generally, as SDs become more regional, the higher the proportion of vehicles manufactured to use diesel fuel. For example, in New South Wales 85.2% of vehicles in the Sydney SD were manufactured to use unleaded petrol, compared to 71.1% in the Mid-North Coast SD and 61.6% in the North Western SD. Conversely, 5.6% of the Sydney SD were manufactured to use diesel fuel, while 13.6% and 23.4% of vehicles in the Mid-North Coast and North Western SDs respectively were diesel vehicles.
 Print Page
 Print All