|
|
KEY FIGURES
|
 | Sep qtr 03 | Jun qtr 03 to Sep qtr 03 | Sep qtr 02 to Sep qtr 03 |  |
 | $m | % change | % change |  |
TREND ESTIMATES(a) |  |
|  |
| Value of work done | 11,340.2 | -0.3 | 1.5 |  |
| New residential building | 6,445.9 | -1.3 | -0.3 |  |
| Alterations and additions to residential building | 1,224.0 | 3.0 | 8.5 |  |
| Non-residential building | 3,662.1 | 0.1 | 2.3 |  |
SEASONALLY ADJUSTED ESTIMATES(a) |  |
|  |
| Value of work done | 11,483.8 | 3.2 | 2.9 |  |
| New residential building | 6,543.3 | 3.0 | 2.5 |  |
| Alterations and additions to residential building | 1,269.9 | 11.1 | 13.1 |  |
| Non-residential building | 3,670.6 | 1.1 | 0.3 |  |
|  |
| (a) Chain volume measures, reference year 2001-02. |
 |  |  |  |  |
VALUE OF WORK DONE
Volume terms

| VALUE OF WORK DONE
Volume terms—Trend estimates

|
KEY POINTS
VALUE OF WORK DONE, Volume Terms
TREND ESTIMATES
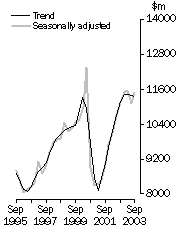
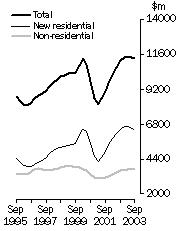
- The trend estimate of the value of total building work done fell 0.3% in the September quarter 2003, and follows a 0.5% fall in the June quarter.
- New residential building work fell 1.3% in the latest quarter. New houses fell 2.7%, the third quarterly fall, but new other dwellings rose 1.3%, the tenth quarterly increase.
- Non-residential work has been steady for the last three quarters.
SEASONALLY ADJUSTED ESTIMATES
- In seasonally adjusted terms, total building work done rose 3.2% in the September quarter to $11,483.8m, the third highest level on record.
- New residential work rose 3.0% to $6,543.3m. New houses were up 3.3% to $4,296.0m and new other dwellings rose 2.5% to a fourth consecutive quarterly record of $2,247.3m. Alterations and additions rose 11.1% to $1,269.9m, the second highest level on record.
- Work done on non-residential building rose 1.1% to $3,670.6m.
ORIGINAL ESTIMATES
- In original terms, total building work done rose 7.8% to $12,014.0m. New houses were up 8.8% to $4,509.3m, new other dwellings up 4.2% to a record $2,316.9m and alterations and additions up 11.1% to a record $1,290.4m. Non-residential work rose 7.9% to $3,897.4m, the highest since the December quarter 1999.
NOTES
ABOUT THIS ISSUE
The data in this publication are subject to revision when returns from the following quarter are processed and final data for the September quarter 2003 will be released in Building Activity, Australia (cat. no. 8752.0) on 19 April 2004.
SIGNIFICANT REVISIONS THIS ISSUE
As reported in the October 2003 issue of Building Approvals, Australia (cat. no. 8731.0), significant revisions were made to the total number of dwellings approved in two municipalities in Queensland. Follow-on upward revisions have been made in this publication for the December quarter 2000 to June quarter 2003 to the number of dwelling units commenced, under construction and completed and to the value of building work commenced, under construction, completed, done and yet to be done.
A review of our estimation methods has led to downward revisions in the number of dwellings commenced and under construction in all states and territories, for the September quarter 2000 to June quarter 2003, as well as in the value of building work commenced, under construction, done and yet to be done. Any enquiries regarding this change should be directed to Tony Bammann on 08 8237 7316.
The combined effect of these changes (together with the usual ‘previous quarter’ revisions for the June quarter 2003), for three of the key variables, are shown below:
|
 | NSW | Vic. | Qld | SA | WA | Tas. | NT | ACT | Aust. |  |
NUMBER OF DWELLINGS COMMENCED (no.) |  |
|  |
| 2000-01 | -188 | -67 | -12 | -18 | -30 | -4 | - | -4 | -323 |  |
| 2001-02 | -618 | -495 | 347 | -48 | -103 | -22 | -7 | -12 | -958 |  |
| 2002-03 | -198 | -141 | 979 | -25 | -277 | -9 | -9 | -21 | 301 |  |
VALUE OF WORK COMMENCED ($m) |  |
|  |
| 2000-01 | -71.0 | -38.4 | -2.9 | -2.2 | -8.2 | -0.8 | -3.2 | -0.8 | -127.6 |  |
| 2001-02 | -121.0 | -124.8 | 39.7 | -10.4 | -24.7 | -2.6 | -5.1 | -3.0 | -251.9 |  |
| 2002-03 | -42.1 | -134.9 | 142.3 | -0.5 | -43.6 | -1.8 | -3.6 | -4.9 | -89.1 |  |
VALUE OF WORK DONE ($m) |  |
|  |
| 2000-01 | -32.3 | -20.6 | 2.5 | -1.2 | -4.1 | -0.4 | -2.7 | -0.4 | -59.1 |  |
| 2001-02 | -68.0 | -67.2 | 45.1 | -4.7 | -12.0 | -1.7 | -3.4 | -2.1 | -114.0 |  |
| 2002-03 | -111.5 | -131.8 | 86.1 | -20.6 | -31.4 | -5.6 | -2.0 | -3.4 | -220.2 |  |
|  |
INQUIRIES
For further information about these and related statistics, contact the National Information and Referral Service on 1300 135 070 or Tony Bammann on Adelaide (08) 8237 7316.
VALUE OF WORK COMMENCED, Volume terms
TREND AND SEASONALLY ADJUSTED ESTIMATES
|
 | Sep qtr 03 | Jun qtr 03 to Sep qtr 03 | Sep qtr 02 to Sep qtr 03 |  |
 | $m | % change | % change |  |
TREND(a) |  |
|  |
| Value of work commenced | 11,192.7 | -1.7 | -6.6 |  |
| New residential building | 6,402.3 | -2.5 | -8.8 |  |
| Alterations and additions to residential building | 1,198.9 | 3.3 | 5.5 |  |
| Non-residential building | 3,613.0 | -1.1 | -5.7 |  |
SEASONALLY ADJUSTED(a) |  |
|  |
| Value of work commenced | 11,560.3 | 4.3 | -2.6 |  |
| New residential building | 6,516.6 | 0.7 | -8.5 |  |
| Alterations and additions to residential building | 1,240.7 | 8.4 | 9.2 |  |
| Non-residential building | 3,803.1 | 9.9 | 5.4 |  |
|  |
| (a) Chain volume measures, reference year 2001-02. |
 |  |  |  |  |
TREND
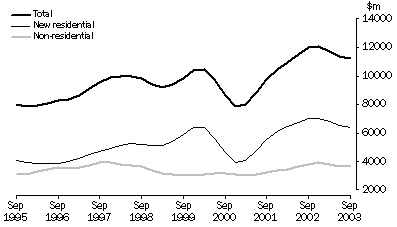
- The trend estimate of the total value of building work commenced fell 1.7% in the September quarter 2003. Although this is the third consecutive quarterly fall, the rate of decline has slowed.
- New residential buildings fell 2.5% in the latest quarter, with an increase of 2.5% in new houses being more than offset by a fall of 11.1% in new other dwellings. Alterations and additions rose 3.3%. Non-residential building commencements fell 1.1%, the third quarterly fall.
VALUE OF WORK COMMENCED IN VOLUME TERMS, Trend

SEASONALLY ADJUSTED
- In seasonally adjusted terms, the total value of building work commenced rose 4.3% in the September quarter 2003 to $11,560.3m, the third highest level on record.
- Commencements of new residential buildings rose 0.7%. An increase of 9.2% in new houses to $4,693.4m, the third highest on record, was largely offset by a fall of 16.2%, to $1,823.2m, in new other residential buildings. Alterations and additions rose 8.4% to a second consecutive quarterly record of $1,240.7m.
- Non-residential work commenced rose 9.9% to $3,803.1m, the second highest level since the June quarter 1998.
VALUE OF WORK DONE, Volume terms, September qtr 2003
SUMMARY COMMENTS
In the September quarter 2003, the seasonally adjusted estimate of total building work done rose in all states and territories. Tasmania recorded the largest increase (+24.3%), followed by the Northern Territory (+13.0%) and Queensland (+9.2%).
In original terms, only the Australian Capital Territory recorded a fall in total building work done. Tasmania recorded the largest increase (+22.1%), followed by Queensland (+16.9%).
|
 |  | NSW | Vic. | Qld | SA | WA | Tas. | NT | ACT | Aust. |  |
ORIGINAL(a) |  |
|  |
| Value of work done |  |  |  |  |  |  |  |  |  |  |
 | New residential building ($m) | 2,084.0 | 1,968.9 | 1,495.3 | 339.6 | 707.2 | 70.5 | 43.6 | 117.2 | 6,826.3 |  |
 | Alterations and additions to residential building ($m) | 493.3 | 409.4 | 188.4 | 75.8 | 73.4 | 18.2 | 6.7 | 25.1 | 1,290.4 |  |
 | Non-residential building ($m) | 1,334.1 | 1,143.6 | 664.6 | 219.1 | 364.8 | 54.2 | 44.3 | 72.7 | 3,897.4 |  |
 | Total building ($m) | 3,911.4 | 3,522.0 | 2,348.2 | 634.5 | 1,145.4 | 143.0 | 94.6 | 215.0 | 12,014.0 |  |
| Percentage change |  |  |  |  |  |  |  |  |  |  |
 | New residential building (%) | 1.1 | 8.4 | 15.4 | 8.1 | 8.0 | 21.2 | 1.7 | -6.6 | 7.2 |  |
 | Alterations and additions to residential building (%) | 10.0 | 14.6 | 9.0 | 27.1 | -5.4 | 21.1 | -22.1 | 11.5 | 11.1 |  |
 | Non-residential building (%) | 4.2 | 2.8 | 23.0 | -7.3 | 28.2 | 23.6 | 19.9 | -5.2 | 7.9 |  |
 | Total building (%) | 3.2 | 7.1 | 16.9 | 4.0 | 12.7 | 22.1 | 7.0 | -4.3 | 7.8 |  |
SEASONALLY ADJUSTED(a) |  |
|  |
| Value of work done |  |  |  |  |  |  |  |  |  |  |
 | New residential building ($m) | 2,038.4 | 1,869.0 | 1,393.4 | 329.9 | 699.6 | 70.0 | na | 117.3 | 6,543.3 |  |
 | Alterations and additions to residential building ($m) | 477.9 | 409.8 | 181.8 | 73.0 | 75.8 | 17.8 | na | 24.0 | 1,269.9 |  |
 | Non-residential building ($m) | 1,319.1 | 1,085.6 | 614.1 | 222.5 | 327.8 | 54.0 | na | 74.1 | 3,670.6 |  |
 | Total building ($m) | 3,835.5 | 3,364.4 | 2,189.3 | 625.4 | 1,103.2 | 141.7 | 92.2 | 215.3 | 11,483.8 |  |
| Percentage change |  |  |  |  |  |  |  |  |  |  |
 | New residential building (%) | -0.9 | 5.1 | 7.1 | 2.8 | 4.3 | 20.1 | na | 4.3 | 3.0 |  |
 | Alterations and additions to residential building (%) | 4.1 | 19.9 | 2.9 | 18.7 | 1.1 | 25.1 | na | 9.1 | 11.1 |  |
 | Non-residential building (%) | 4.2 | -2.1 | 16.3 | -3.8 | 7.5 | 29.8 | na | -7.4 | 1.1 |  |
 | Total building (%) | 1.4 | 4.2 | 9.2 | 1.9 | 5.0 | 24.3 | 13.0 | 0.4 | 3.2 |  |
|  |
| na not available |
 |  |  |  |  |  |  |  |  |  |  |  |
| (a) Chain volume measures, reference year 2001-02. |
 |  |  |  |  |  |  |  |  |  |  |  |
VALUE OF WORK DONE, Volume terms
TREND ESTIMATES
New South Wales, Victoria, Queensland
The trend estimate of the total value of building work done fell in Victoria over the last three quarters. In New South Wales the trend turned downwards only in the latest quarter, while in Queensland, it has been steady for the last three quarters.
South Australia, Western Australia
The trend estimate of the total value of building work done continued to rise in both South Australia and Western Australia.
Tasmania, Northern Territory, Australian Capital Territory
The trend estimate of the total value of building work done has declined in the Australian Capital Territory for the last two quarters, following a period of high growth. In Tasmania, work done has resumed an upward trend over the last two quarters. In the Northern Territory the slow decline evident over the previous six quarters, has been halted in the latest quarter.
|
 Print Page
 Print All