|
|
Please Note: Due to a technical problem, this Main Features was incorrect on the web site between 11.30am (Canberra time) 27 October 2003 and 11.30am 29 October 2003. The ABS apologises for any inconvenience this may have caused.
KEY FIGURES
|
 | Jun qtr 03
$m | Mar qtr 03 to
Jun qtr 03
% change | Jun qtr 02 to
Jun qtr 03
% change |
 |
 |
|
| TREND ESTIMATES(a) |  |  |  |
|
| Value of work done | 11,416.7 | -0.5 | 6.6 |
| New residential building | 6,572.9 | -0.8 | 7.0 |
| Alterations and additions to |  |  |  |
| residential building | 1,166.7 | 0.3 | 6.6 |
| Non-residential building | 3,677.3 | -0.4 | 5.8 |
|
| SEASONALLY ADJUSTED ESTIMATES(a) |  |  |  |
|
| Value of work done | 11,273.3 | -2.5 | 5.5 |
| New residential building | 6,452.5 | -3.3 | 4.3 |
| Alterations and additions to residential building | 1,161.3 | -0.5 | 4.5 |
| Non-residential building | 3,659.5 | -1.6 | 8.2 |
|
| (a) Chain volume measures, reference year 2001-02. |
VALUE OF WORK DONE
Volume terms
 | VALUE OF WORK DONE
Volume terms
Trend estimates
 |
KEY POINTS
VALUE OF WORK DONE, VOLUME TERMS
TREND ESTIMATES
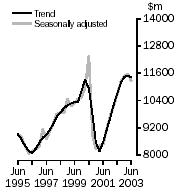
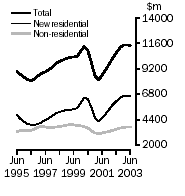
- The trend estimate of the value of total building work done fell 0.5% in the June quarter 2003, following eight consecutive quarterly increases.
- New residential building work fell 0.8% in the latest quarter, with new houses down 2.6% but new other residential buildings up 3.0%—the ninth consecutive quarterly increase.
- Non-residential work done fell 0.4% following eight quarters of growth.
SEASONALLY ADJUSTED ESTIMATES
- In seasonally adjusted terms, total building work done fell 2.5% in the June quarter to $11,273.3m, following nine quarterly increases.
- New residential work fell 3.3% to $6,452.5m. New houses were down 5.6% to $4,224.7m, but new other dwellings rose 1.3% to a record $2,227.8m. Alterations and additions fell 0.5% to $1,161.3m, only the second quarterly fall since the September quarter 2000.
- Work done on non-residential building fell 1.6% to $3,659.5m.
ORIGINAL ESTIMATES
- In original terms, total building work done rose 5.9% to $11,336.3m. New houses were up 1.2% to $4,208.6m and new other dwellings up 9.4% to $2,275.4m. Alterations and additions rose 9.7% to $1,180.8m and non-residential work rose 8.3% to $3,671.5m.
NOTES
ABOUT THIS ISSUE
This publication contains detailed estimates from the quarterly Building Activity Survey. The data are subject to revision when returns from the following quarter are processed and final data for the June quarter 2003 will be released in Building Activity, Australia (cat. no. 8752.0) on 19 January 2004.
CHANGES IN THIS ISSUE
Quarterly chain volume data incorporate a new base year, 2001-02, which has resulted in revisions to growth rates, small in most cases, for subsequent periods. In addition, the reference year has been advanced to 2001-02, thereby preserving additivity in the quarters after the reference year. Re-referencing resulted in revisions to levels, but not growth rates, for all periods.
Seasonally adjusted and trend estimates have been revised as a result of the adoption of new seasonal adjustment methodology. Concurrent seasonal adjustment has replaced forward factor methodology for all seasonally adjusted series in this publication. See paragraphs 31 and 32 of the Explanatory Notes.
SIGNIFICANT REVISIONS THIS ISSUE
Some non-residential building work commenced in Western Australia in the September quarter 2002, previously classified as work commenced for the public sector, has now been reclassified as work commenced for the private sector. The revisions affect tables 5, 6 and 15. The corresponding work done from and including the September quarter 2002 has also been reclassified as work done for the private sector. The revisions affect tables 1, 2 and 13.
Compared with the estimates in original terms published in the previous issue of this publication:
- the total number of dwellings commenced during the March quarter 2003 has been revised downwards by 471 (-1.2%). This was mainly the result of downward revisions of 240 (-2.9%) in Queensland and 144 (-1.4%) in Victoria, and
- the total value of non-residential building work commenced during the March quarter has been revised downwards by $38.2m (-1.0%), with the main contributor to the decrease being Queensland, $21.6m (-4.3%).
FURTHER INFORMATION
For further information about these and related statistics, contact the National Information and Referral Service on 1300 135 070 or Tony Bammann on Adelaide (08) 8237 7316.
VALUE OF WORK COMMENCED, VOLUME TERMS
TREND AND SEASONALLY ADJUSTED ESTIMATES
|
 | Jun qtr 03 | Mar qtr 03 to
Jun qtr 03 | Jun qtr 02 to
Jun qtr 03 |
 |
 |  |
 | $m | % change | % change |
|
TREND(a) |
|
| Value of work commenced | 11,234.6 | -4.5 | -2.7 |
| New residential building | 6,437.5 | -4.8 | -4.8 |
| Alterations and additions to residential building | 1,121.1 | -0.7 | -0.3 |
| Non-residential building | 3,672.3 | -5.1 | 0.3 |
|
SEASONALLY ADJUSTED(a) |
|
| Value of work commenced | 11,072.1 | -3.1 | -1.8 |
| New residential building | 6,423.6 | -3.3 | -5.0 |
| Alterations and additions to residential building | 1,132.0 | 2.0 | 1.1 |
| Non-residential building | 3,516.6 | -4.3 | 3.7 |
|
| (a) Chain volume measures, reference year 2001-02. |
TREND
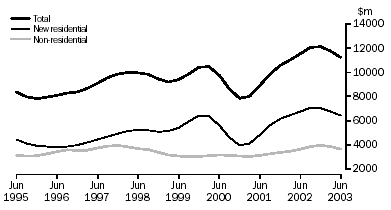
- The trend estimate of the total value of building work commenced fell 4.5% in the June quarter 2003, following a 3.0% fall in the March quarter.
- Commencements in all categories of building fell. New residential buildings fell 4.8%, with new houses down 4.7% (the third consecutive quarterly fall), new other dwellings down 4.5% (the second quarterly fall) and alterations and additions down 0.7% (the third quarterly fall). Non-residential building fell 5.1% in the latest quarter, the second quarterly fall.
VALUE OF WORK COMMENCED IN VOLUME TERMS, Trend

SEASONALLY ADJUSTED
- In seasonally adjusted terms, the total value of building work commenced fell 3.1% in the June quarter 2003 to $11,072.1m. This followed a 10.4% fall in the March quarter.
- Commencements of new residential buildings fell 3.3% (the third consecutive quarterly fall), with new houses down 2.8% to $4,173.8m and new other residential buildings down 4.3% to $2,249.8m. Alterations and additions rose 2.0% to $1,132.0m.
- Non-residential work commenced fell 4.3% to $3,516.6m, following a 17.5% rise in the March quarter.
VALUE OF WORK DONE, VOLUME TERMS, JUNE QTR 2003
SUMMARY COMMENTS
In the June quarter 2003, the seasonally adjusted estimate of total building work done fell in all states and territories except South Australia.
In original terms, only the Australian Capital Territory recorded a fall in total building work done, with the Northern Territory recording the largest increase (+27.7%) followed by South Australia (+13.6%) and Tasmania (+12.5%).
|
 | NSW | Vic. | Qld | SA | WA | Tas. | NT | ACT | Aust. |
|
ORIGINAL(a) |
|
| Value of work done |  |  |  |  |  |  |  |  |  |
| New residential building ($m) | 2,108.1 | 1,842.2 | 1,303.4 | 325.7 | 673.4 | 61.8 | 42.9 | 126.5 | 6,484.0 |
| Alterations and additions to residential building ($m) | 454.1 | 364.2 | 175.6 | 60.1 | 80.2 | 15.5 | 8.7 | 22.5 | 1,180.8 |
| Non-residential building ($m) | 1,296.3 | 1,143.2 | 545.4 | 239.9 | 288.0 | 44.4 | 37.7 | 76.5 | 3,671.5 |
| Total building ($m) | 3,858.5 | 3,349.6 | 2,024.4 | 625.7 | 1,041.5 | 121.7 | 89.3 | 225.5 | 11,336.3 |
| Percentage change |  |  |  |  |  |  |  |  |  |
| New residential building (%) | 6.5 | -0.7 | 4.5 | 9.6 | 3.7 | 8.1 | 26.2 | 5.1 | 3.9 |
| Alterations and additions to residential building (%) | 4.8 | 9.8 | 19.8 | 7.8 | 11.4 | 24.9 | 29.2 | 29.8 | 9.7 |
| Non-residential building (%) | 12.1 | 9.3 | 6.8 | 21.1 | -7.7 | 14.9 | 29.2 | -21.2 | 8.3 |
| Total building (%) | 8.1 | 3.6 | 6.3 | 13.6 | 0.8 | 12.5 | 27.7 | -4.0 | 5.9 |
|
SEASONALLY ADJUSTED(a) |
|
| Value of work done |  |  |  |  |  |  |  |  |  |
| New residential building ($m) | 2,098.0 | 1,798.1 | 1,303.0 | 330.1 | 683.1 | 61.1 | na | 112.8 | 6,452.5 |
| Alterations and additions to residential building ($m) | 461.0 | 347.2 | 175.2 | 61.0 | 76.8 | 13.8 | na | 21.6 | 1,161.3 |
| Non-residential building ($m) | 1,270.0 | 1,132.9 | 523.6 | 235.0 | 296.5 | 39.7 | na | 81.5 | 3,659.5 |
| Total building ($m) | 3,829.0 | 3,278.1 | 2,001.7 | 626.0 | 1,056.4 | 114.6 | 80.8 | 215.9 | 11,273.3 |
| Percentage change |  |  |  |  |  |  |  |  |  |
| New residential building (%) | -3.1 | -8.9 | -4.3 | 6.8 | 2.6 | 0.5 | na | -16.3 | -3.3 |
| Alterations and additions to residential building (%) | 2.1 | -3.6 | 5.7 | 2.4 | 1.0 | -5.9 | na | 6.9 | -0.5 |
| Non-residential building (%) | 2.4 | -3.0 | -9.1 | 9.2 | -11.7 | -11.2 | na | -18.3 | -1.6 |
| Total building (%) | -0.7 | -6.4 | -4.9 | 7.2 | -2.0 | -4.6 | -2.8 | -15.3 | -2.5 |
|
na not available
(a) Chain volume measures, reference year 2001-02. |  |
VALUE OF WORK DONE, Volume terms
TREND ESTIMATES
New South Wales, Victoria, Queensland
- The trend estimate of the total value of building work done fell over the last two quarters in both Victoria and Queensland. While continuing to climb in New South Wales, the rate of growth has slowed considerably over recent quarters.
South Australia, Western Australia
- The trend estimate of the total value of building work done continued to rise in South Australia but fell marginally in Western Australia in the June quarter following a period of sustained growth.
Tasmania, Northern Territory, Australian Capital Territory
- The trend estimate of the total value of building work done has continued to climb in the Australian Capital Territory, albeit at a sharply reduced rate of growth in the June quarter 2003. In Tasmania the trend has fallen for the last three quarters, while it has declined in five of the last six quarters for the Northern Territory.
|
 Print Page
 Print All