NOVEMBER KEY FIGURES
 | Nov 05 | Oct 05 to Nov 05 | Nov 04 to Nov 05 |
 | no. | % change | % change |
Trend |
|
| Total dwelling units approved | 12 107 | -1.1 | -4.6 |
| Private sector houses | 8 373 | -1.1 | -2.0 |
| Private sector other dwellings | 3 338 | -0.9 | -12.8 |
Seasonally Adjusted |
|
| Total dwelling units approved | 12 544 | 3.4 | -3.8 |
| Private sector houses | 8 532 | 2.6 | -1.4 |
| Private sector other dwellings | 3 649 | 7.6 | -7.5 |
|
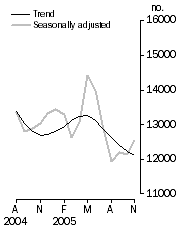
Dwelling units approved, Total number

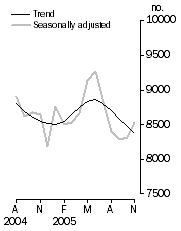
| Private sector houses approved, Total number

|
NOVEMBER KEY POINTS
TOTAL DWELLING UNITS
- The trend for total dwelling approvals fell 1.1% in November 2005, the sixth consecutive monthly fall.
- The seasonally adjusted estimate for total dwelling units approved rose 3.4%, to 12,544, in November 2005.
PRIVATE SECTOR HOUSES
- The trend estimate of private sector house approvals fell 1.1% in November 2005.
- The seasonally adjusted estimate for private sector houses approved rose 2.6 %, to 8,532, in November 2005.
PRIVATE SECTOR OTHER DWELLING UNITS
- The trend estimate of private sector other dwellings approved fell 0.9% in November 2005. This is the seventh consecutive monthly fall, although the rate of decline has slowed in recent months.
- The seasonally adjusted estimate for private sector other dwellings approved rose 7.6%, to 3,649, in November 2005.
VALUE OF BUILDING APPROVED
- The trend estimate of the value of total building approved was unchanged in November 2005. The value of new residential building approved fell 2.0% while the value of alterations and additions rose 1.2%. The value of non-residential building approved rose 2.3%, the tenth consecutive monthly rise.
- The seasonally adjusted estimate of the value of total building approved rose 7.8%, to $4,984.9m, in November 2005. The value of new residential building approved rose 1.8%, to $2,434.8m. The value of alterations and additions rose 3.8%, to $456.6m.
NOTES
FORTHCOMING ISSUES
| ISSUE | Release Date |
| December 2005 | 2 February 2006 |
| January 2006 | 2 March 2006 |
| February 2006 | 31 March 2006 |
| March 2006 | 5 May 2006 |
| April 2006 | 30 May 2006 |
| May 2006 | 3 July 2006 |
REVISIONS THIS MONTH
Revisions to Total Dwellings in this issue are:
 | 2004-05 | 2005-06 | Total |
|
| New South Wales | 9 | 220 | 229 |
| Victoria | 39 | - | 39 |
| Queensland | 16 | 92 | 108 |
| South Australia | - | 2 | 2 |
| Western Australia | - | -17 | -17 |
| Tasmania | - | - | - |
| Northern Territory | - | - | - |
| Australian Capital Territory | - | - | - |
| TOTAL | 64 | 297 | 361 |
|
INQUIRIES
For further information about these and related statistics, contact the National Information and Referral Service on 1300 135 070 or Paul Pamment on Adelaide (08) 8237 7499.
VALUE OF BUILDING APPROVED
NEW RESIDENTIAL BUILDING
The trend estimate of the value of new residential building has fallen for the past six months. The trend fell 2.0% in November 2005.
ALTERATIONS AND ADDITIONS TO RESIDENTIAL BUILDING
The trend estimate of the value of alterations and additions to residential building is now showing a rise for the past three months. The trend rose 1.2% in November 2005.
NON-RESIDENTIAL BUILDING
The trend estimate of the value of non-residential building shows ten months of growth, rising 2.3% in November 2005.
DWELLINGS APPROVED
TOTAL DWELLING UNITS
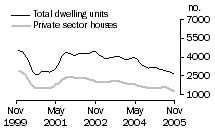
The trend estimate for total dwelling units approved has fallen for the sixth consecutive month. This follows six months of modest growth.
PRIVATE SECTOR HOUSES
The trend estimate for private sector houses approved is showing falls for the past five months, after five months of growth.
PRIVATE SECTOR OTHER DWELLINGS
The trend estimate for private sector other dwellings approved shows falls for the past seven months, although the rate of decline has slowed in recent months. The trend fell 0.9% in November 2005.
DWELLING UNITS APPROVED STATES AND TERRITORIES
SUMMARY COMMENTS
The trend estimate for total dwelling units approved fell 1.1% in November 2005. The trend fell in all the states and territories other than Western Australia (+1.8%), South Australia (+1.2%) and the Northern Territory (unchanged).
The trend estimate for private sector houses approved fell 1.1% in November 2005. The trend fell in New South Wales (-6.6%), Victoria (-1.4%) and Queensland (-0.8%) but rose in South Australia (+0.9%) and Western Australia (+2.4%).
 |  | NSW | Vic. | Qld | SA | WA | Tas. | NT | ACT | Aust. |  |
Original |  |
|  |
| Dwelling units approved |  |  |  |  |  |  |  |  |  |  |
 | Private sector houses (no.) | 1 339 | 2 802 | 2 052 | 731 | 1 955 | 199 | 54 | 108 | 9 240 |  |
 | Total dwelling units (no.) | 2 949 | 3 418 | 3 222 | 892 | 2 362 | 213 | 127 | 124 | 13 307 |  |
| Percentage change from previous month |  |  |  |  |  |  |  |  |  |  |
 | Private sector houses (%) | 8.7 | 28.8 | -5.3 | 19.8 | 2.2 | 17.8 | 42.1 | 54.3 | 10.4 |  |
 | Total dwelling units (%) | 20.1 | 11.2 | 1.0 | -4.0 | 7.4 | 3.4 | 81.4 | 67.6 | 9.1 |  |
Seasonally Adjusted |  |
|  |
| Dwelling units approved |  |  |  |  |  |  |  |  |  |  |
 | Private sector houses (no.) | 1 197 | 2 577 | 1 993 | 674 | 1 771 | na | na | na | 8 532 |  |
 | Total dwelling units (no.) | 2 661 | 3 404 | 3 019 | 863 | 2 168 | 191 | na | na | 12 544 |  |
| Percentage change from previous month |  |  |  |  |  |  |  |  |  |  |
 | Private sector houses (%) | -5.2 | 17.7 | -0.8 | 5.9 | -8.7 | na | na | na | 2.6 |  |
 | Total dwelling units (%) | 0.9 | 19.2 | -3.1 | -7.6 | -3.6 | -5.0 | na | na | 3.4 |  |
Trend |  |
|  |
| Dwelling units approved |  |  |  |  |  |  |  |  |  |  |
 | Private sector houses (no.) | 1 261 | 2 384 | 1 979 | 657 | 1 798 | na | na | na | 8 373 |  |
 | Total dwelling units (no.) | 2 671 | 3 032 | 2 976 | 899 | 2 124 | 200 | 115 | 93 | 12 107 |  |
| Percentage change from previous month |  |  |  |  |  |  |  |  |  |  |
 | Private sector houses (%) | -6.6 | -1.4 | -0.8 | 0.9 | 2.4 | na | na | na | -1.1 |  |
 | Total dwelling units (%) | -1.9 | -1.6 | -2.0 | 1.2 | 1.8 | -2.0 | - | -9.7 | -1.1 |  |
|  |
| - nil or rounded to zero (including null cells) |
| na not available |
DWELLING UNITS APPROVED STATE TRENDS
NEW SOUTH WALES
The trend estimate for total dwelling units approved in New South Wales shows falls for the past ten months. The trend for private sector houses shows falls for the past five months.
Page 5 Graph - NSW

VICTORIA
The trend estimate for total dwelling units approved in Victoria shows falls for the past six months. The trend for private sector houses shows falls for the past six months.
QUEENSLAND
The trend estimates for total dwelling units approved in Queensland shows falls for the past five months. The trend for private sector houses shows falls for the past five months.
SOUTH AUSTRALIA
The trend estimate for total dwelling units approved in South Australia is showing a general rise over the last twelve months. The trend for private sector houses is showing a modest rise for the last two months.
WESTERN AUSTRALIA
The trend estimate for total dwelling units approved in Western Australia is now showing rises for the past four months. The trend for private sector houses is now showing strong rises for the past five months.
.
 Print Page
 Print All