|
|
SUMMARY OF FINDINGS
- There were 2,100,162 actively trading businesses in Australia in June 2014.
- The number of actively trading businesses in Australia increased by 1% between June 2013 and June 2014.
- The business entry rate increased from 11.2% in 2012-13 to 13.7% in 2013-14.
- The business exit rate decreased from 14.0% in 2012-13 to 12.7% in 2013-14.
- 61.7% of the businesses that were actively trading in Australia in June 2010 were still operating in June 2014.
- Half of the businesses that started operating in 2010-11 were still operating in June 2014.
OF THE 19 INDUSTRY DIVISIONS
- Construction had the most businesses operating in Australia in June 2014.
- Electricity, Gas, Water and Waste Services had the fewest businesses operating in Australia in June 2014.
- Accommodation and Food Services had the highest business entry rate in 2013-14.
- Agriculture, Forestry and Fishing had the lowest business entry rate in 2013-14.
- Public Administration and Safety had the highest business exit rate in 2013-14.
- Health Care and Social Assistance had the lowest business exit rate in 2013-14.
- Health Care and Social Assistance businesses were the most likely to survive from June 2010 to June 2014.
- Public Administration and Safety businesses were the least likely to survive from June 2010 to June 2014.
Survival rates of businesses that started in 2010-11

OF THE STATES AND TERRITORIES
- Counts of businesses mainly operating in Tasmania and South Australia reduced in June 2014 from June 2013, while all other states and territories increased.
- The Australian Capital Territory had the highest business entry rate in 2013-14.
- The Northern Territory had the highest business exit rate in 2013-14.
- Businesses mainly operating in Tasmania were the most likely to survive from June 2010 to June 2014.
- Businesses mainly operating in the Australian Capital Territory were the least likely to survive from June 2010 to June 2014.
Actively trading businesses by main state/territory of operation

OF THE INSTITUTIONAL SECTORS
- Most businesses actively trading in Australia in June 2014 were unincorporated businesses owned and operated by the household sector.
- Between June 2013 and June 2014, the number of non-financial corporations and financial corporations increased while the number of household sector businesses decreased.
- The non-financial corporations sector had the highest business entry rate in 2013-14.
- The household sector had the highest exit rate in 2013-14.
- Non-financial corporations and financial corporations were more likely than household sector businesses to survive from June 2010 to June 2014.
- Financial corporations that started operating in 2010-11 were the most likely to have still been operating in June 2014.
Institutional sector of actively trading businesses

OF THE TYPES OF LEGAL ORGANISATION
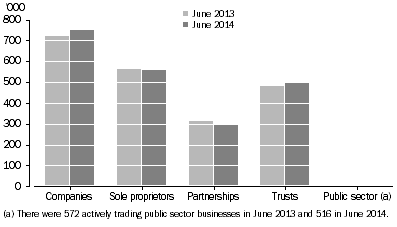
- Public sector businesses were the least common, with only 516 actively trading goods or services in Australia in June 2014.
- Between June 2013 and June 2014, the number of actively trading companies and trusts increased while the number of actively trading sole proprietors, partnerships and public sector businesses each decreased.
- The business entry rate was highest for sole proprietors in 2013-14.
- The business exit rate was highest for public sector businesses in 2013-14.
- Trusts were the most likely to survive from June 2010 to June 2014.
Type of legal organisation of actively trading businesses

OF THE EMPLOYMENT SIZE RANGES
- In June 2014, 61% of actively trading businesses in Australia had no employees, 27% had 1-4, 10% had 5-19, 2% had 20-199, and less than 1% had 200 or more.
- Among businesses operating in both June 2013 and June 2014, there was net movement away from having 1-4 employees in June 2013 towards either having no employees or having more than 4 employees in June 2014.
- The more employees an ongoing business had in June 2010 the more likely it would survive.
- For a business that started operating in 2010-11, the more employees it had the more likely it would survive.
- In 2013-14, business entry and exit rates were highest for businesses with no employees.
Business entry and exit rates by number of employees - 2013-14
 OF THE TURNOVER SIZE RANGES
- In June 2014, most actively trading businesses had annual turnover under $200,000.
- Among businesses operating in both June 2013 and June 2014, there was net movement away from having annual turnover of between $50,000 and under $2 million in June 2013, towards having annual turnover of either less than $50,000 or at least $2 million in June 2014.
- The more turnover a business had in June 2010 the more likely it would survive.
- Businesses that started operating in 2010-11 and had higher turnover ranges were more likely to survive.
- In 2013-14, business entry rates were highest for businesses with annual turnover of between $50,000 and $199,999 and lowest for businesses with annual turnover of $2 million or more.
- In 2013-14, business exit rates were highest for businesses with annual turnover under $50,000 and lowest for businesses with annual turnover of $2 million or more.
Business entry and exit rates by annual turnover - 2013-14

|
|
 Quality Declaration
  Print Page
 Print All