BUSINESS RESOURCES DEVOTED TO RESEARCH AND EXPERIMENTAL DEVELOPMENT (R&D)
During 2013-14, expenditure on R&D by Australian businesses was $18,849 million. Business expenditure on R&D (BERD) increased by 3% in current price terms and increased by 1% in chain volume terms in 2013-14.
Business human resources devoted to R&D in 2013-14 totalled 78,839 person years of effort (PYE), an increase of 21% from 2011-12.
BUSINESS RESOURCES DEVOTED TO R&D |
|
 |  |  | 2008-09 | 2009-10 | 2010-11 | 2011-12 | 2013-14 |
|
| Expenditure on R&D |  |  |  |  |  |  |
 | Current prices | $m | 17 291 | 16 760 | 18 007 | 18 321 | 18 849 |
 | Chain volume measures(a) | $m | 18 425 | 17 479 | 18 763 | 18 636 | 18 849 |
| Human resources devoted to R&D | PYE | 53 886 | 57 936 | 56 511 | 64 906 | 78 839 |
|
| (a) The reference year for chain volume measures is 2013-14. Refer to the Explanatory Notes for details. |
Subsequent expenditure figures and supporting commentary relate to current price terms.
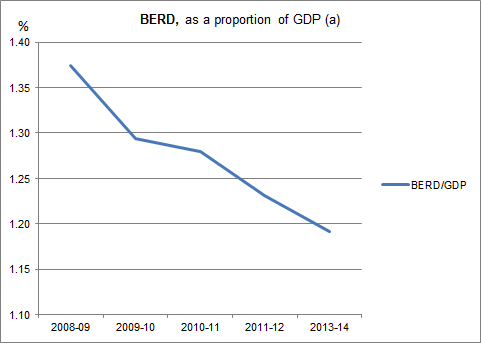
BERD as a proportion of GDP decreased, down from 1.23% in 2011-12 to 1.19% in 2013-14.
 (a) Refer to the Explanatory Notes for details.
BUSINESS EXPENDITURE ON R&D, summary statistics: values and proportions |
|
 |  |  | EXPENDITURE ON R&D | PROPORTION OF TOTAL EXPENDITURE ON R&D |
 |  |  | 2011-12 | 2013-14 | 2011-12 | 2013-14 |
 |  |  | $m | $m | % | % |
|
| Type of expenditure |  |  |  |  |
 | Capital expenditure |  |  |  |  |
 |  | Land, buildings and other structures | 198 | 291 | 1.1 | 1.6 |
 |  | Other capital expenditure | 1 056 | 872 | 5.8 | 4.6 |
 |  | Total(a) | 1 254 | 1 163 | 6.9 | 6.2 |
 | Current expenditure |  |  |  |  |
 |  | Labour costs | 7 269 | 8 701 | 39.7 | 46.2 |
 |  | Other current expenditure | 9 798 | 8 986 | 53.5 | 47.7 |
 |  | Total(a) | 17 067 | 17 686 | 93.2 | 93.8 |
 |  |  |  |  |
| Total expenditure on R&D(a) | 18 321 | 18 849 | 100.0 | 100.0 |
|
| (a) Where figures have been rounded, discrepancies may occur between the sum of the component items and totals. |
 |
 |
BUSINESS HUMAN RESOURCES DEVOTED TO R&D, summary statistics: values and proportions |
|
 | HUMAN RESOURCES DEVOTED TO R&D | PROPORTIONS OF HUMAN RESOURCES DEVOTED TO R&D |
 |  |  |  |  |
 | 2011-12 | 2013-14 | 2011-12 | 2013-14 |
 | PYE | PYE | % | % |
|
| Types of resources |  |  |  |  |
Researchers
Technicians
Other staff
| 32 439
21 514
10 953 | 39 065
26 547
13 228 | 50.0
33.2
16.9 | 49.6
37.7
16.8 |
| Total human resources devoted to R&D(a) | 64 906 | 78 839 | 100.0 | 100.0 |
|
| (a) Where figures have been rounded, discrepancies may occur between the sum of the component items and totals. |
 Quality Declaration
  Print Page
 Print All