NOTES
ABOUT THIS PUBLICATION
This publication presents information about retirement and retirement intentions of people aged 45 years and over who have, at some time, worked for two weeks or more. The data examines retirement trends, factors which influence decisions to retire, and the income arrangements retirees and potential retirees have made to provide for their retirement. The data are cross-classified by a range of demographic characteristics such as age, sex, marital status and country of birth, as well as labour force characteristics.
The statistics in this publication were compiled from the retirement and retirement intentions topic included in the Multi-Purpose Household Survey (MPHS), conducted throughout Australia from August 2004 to June 2005 as a supplement to the Australian Bureau of Statistics (ABS) monthly Labour Force Survey (LFS). This topic will be repeated every two years. Retirement and retirement intentions data was previously collected on an irregular basis as part of the supplementary survey program. For details about comparability with previous surveys see paragraph 22 of the Explanatory Notes.
The other topics collected in the 2004-05 MPHS were:
DATA NOTES
The MPHS was designed primarily to provide estimates at the Australia level. Broad estimates are also available for states and territories, although users should exercise caution when using estimates at this level, because of the presence of high sampling errors.
Estimates in the electronic tables have been presented to the nearest 100, but the underlying numbers have been set at six decimal places to allow users the flexibility to calculate proportions or to aggregate estimates. Users should take note of the corresponding Relative Standard Errors (RSEs) to determine the reliability of the estimates and whether they are appropriate to use. For further information about the reliability of estimates see paragraph 13 of the Explanatory Notes. For details about how to calculate RSEs for estimates that have been aggregated see paragraphs 9 to 15 of the Technical Note.
ROUNDING
As estimates have been rounded, discrepancies may occur between sums of the component items and totals.
INQUIRIES
For further information about these and related statistics, contact the National Information and Referral Service on 1300 135 070 or Labour Market Statistics Section on Canberra (02) 6252 7206.
SUMMARY COMMENTARY
SUMMARY OF FINDINGS
OVERVIEW
Since 1995, Australia's estimated resident population aged 45 years and over has increased by 30%. In contrast, the number of children (aged 0 to 14 years) has increased 2.3%, and the number of people aged 15 to 44 years has increased 4.8%1. This uneven distribution of growth reflects the gradual ageing of Australia's population, which inevitably impacts on labour market supply, retirement and income support policies.
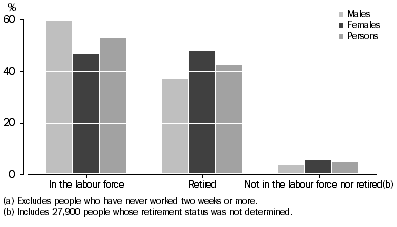
Data from the 2004-05 Multi-Purpose Household Survey (MPHS) showed that of the 7 million people aged 45 years and over who had, at some time, worked for two weeks or more, 3.7 million (53%) were in the labour force, 3 million (42%) had retired from the labour force, and the remaining 329,900 (4.6%) were neither in the labour force nor retired (consisting of people who intended to work in the future or whose retirement status was not determined). A greater proportion of men were in the labour force (59%), than women (47%).
Labour force status of people aged 45 years and over(a), by sex
Of the 3.7 million people in the labour force, 3.4 million (90%) indicated that they intend to retire from the labour force in the future, while 384,400 (10%) never intend to retire.
RETIRED FROM THE LABOUR FORCE
In 2004-05, an estimated 3 million people aged 45 years and over were retired from the labour force. This group comprised 1.3 million men (44%) and 1.7 million women (56%). Almost half of the retired people were aged 70 years and over (52% of men and 47% of women).
Age at retirement
The average age at retirement from the labour force for people aged 45 years and over in 2004-05 was 52 years (58 years for men and 47 years for women). Of the 1.3 million men who had retired from the labour force:
- 19% had retired aged 65 years and over;
- 55% had retired aged 55-64 years;
- 18% had retired aged 45-54 years; and
- 7.8% had retired aged less than 45 years.
The 1.7 million women who had retired from the labour force tended to retire earlier than men. The ages that they retired from the labour force were as follows:
- 6.0% had retired aged 65 years and over;
- 32% had retired aged 55-64 years;
- 29% had retired aged 45-54 years; and
- 33% had retired aged less than 45 years.
It is important to note that data on retirement age presented in this publication only refer to 'surviving' retirees aged 45 years and over in 2004-05. Therefore, the distribution of retirement age in this population is not representative of the age at which people retire. For example, based on Australian life expectancy, a person who retired aged 40 years in 1979-80 (aged 65 years in 2004-05) would more likely be alive to participate in this survey than a person who retired aged 65 years in 1979-80 (aged 90 years in 2004-05). This effect will be more pronounced for estimates presented in relation to people who retired a long time ago, but will have some affect on all estimates, particularly as almost 35% of the retired population included in this publication retired more than 20 years ago.
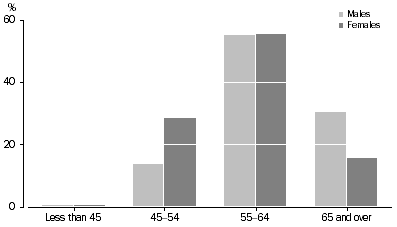
The average age at retirement for recent retirees (those who retired in the last five years) was 60 years. Of this group, the difference between the retirement age of men and women was relatively small, with women retiring approximately three years younger than men (the average retirement age for men was 61.5 years for men and 58.3 years for women).
People who retired in the last five years, Age at retirement by sex
Reasons for ceasing last job
Of the 1.9 million retired people who had worked in the last 20 years, 95% (99% of men and 89% of women) had held a full-time job at some stage. For most people who had held a full-time job (76%), their last job held prior to retirement was full-time. The remainder of people (24%) worked part-time before retiring and were mostly women (72%).
Among both retired men and women whose last job was less than 20 years ago, the main reason for ceasing their last job was due to 'reaching retirement age/being eligible to receive superannuation or the pension' (34%). These people had one of the highest average retirement ages of 62 years, which reflects ages of eligibility to receive such retirement scheme funds. Other reasons that people ceased their last job were due to 'sickness, injury or ill health' (26%) and 'being retrenched, dismissed or no work available' (11%).
Sources of income during retirement
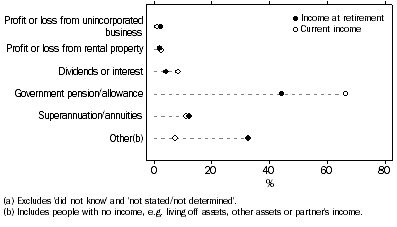
Of people aged 45 years and over who had retired from the labour force, just over 1.3 million people (44%) reported a government pension or allowance as their main source of income just after retirement (54% of men and 37% of women). A further 384,700 people (13%) reported no income source but lived off savings, lump sum payments or other assets, and 366,700 people (12%) reported superannuation or annuity payments (20% of men and 6.3% of women).
Forty-two per cent of those retired from the labour force indicated that their main source of income had changed since retirement. There were almost 2 million people (67% of all those who were retired) who reported that their main source of current income was a government pension or allowance, representing an increase of 50% compared with the number of people who stated it as their main source of income at retirement. This may be due to people reaching the eligible age to receive a pension or allowance during their retirement rather than at the start of their retirement, or due to assets or other sources of income being exhausted.
A large proportion of people whose main source of income at retirement was 'superannuation/annuties' or 'profit/loss from rental properties' continued to rely on them as their main source of current income (67% and 66% respectively).
People who have retired from the labour force, Main source of income(a)
Superannuation scheme membership
Of the 2.3 million people who retired from the labour force when they were aged 45 years or over, 1.3 million (55%) had made contributions to a superannuation scheme at some stage. Of this group, 842,500 people (or 66%) had received all or part of their superannuation funds as a lump sum payment. Many of those who received a lump sum payment used it to pay off or improve their existing home or purchase a new home (31%), to buy or pay off a motor vehicle (14%), or clear other outstanding debts (11%). Some reinvested their lump sum payment into an approved deposit fund, deferred annuity or other superannuation scheme (22%), an immediate annuity (2.1%), or a bank account, personal savings or other investment (23%).
PREVIOUSLY RETIRED
There were 209,900 people aged 45 years and over who had previously retired from the labour force but at survey date were either in the labour force or planning to look for, or take up, work in the future. Most of this group were women (149,000 or 71%), and most were in the labour force at survey date (186,200 or 89%). Of those employed, 58% (or 106,600 people) were working part-time.
The most common reason for returning to the labour force was due to financial need (45%), followed by boredom or needing something to do (36%).
INTENTIONS TO RETIRE FROM THE LABOUR FORCE
Of the 3.7 million people in the labour force aged 45 years and over, 3.4 million (90%) indicated that they intend to retire from the labour force in the future. The remaining 384,400 people indicated that they never intend to retire from the labour force.
Age intends to retire
Of the 3.4 million people in the labour force who indicated that they intend to retire from the labour force, almost half (47%) did not know at what age they would retire. Of those that did indicate an age:
- 8.4% intended to retire aged 70 years and over (10% of men and 6.2% of women);
- 39% intended to retire aged 65-69 years (46% of men and 30% of women);
- 31% intended to retire aged 60-64 years (30% of men and 33% of women);
- 19% intended to retire aged 55-59 years (14% of men and 27% of women); and
- 2.3% intended to retire aged less than 55 years (1.1% of men and 4.1% of women).
The average age people intended to retire was 62 years (63 years for men and 61 years for women).
Factors influencing decision about when to retire
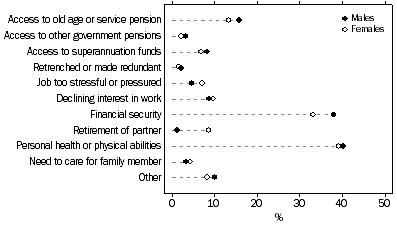
Among people in the labour force who intended to retire, the most common factors influencing their decision about when they would retire were personal health or physical abilities (40%), financial security (36%) and reaching the eligible age for an old age or service pension (15%).
People in the labour force who intend to retire, All factors influencing decision about when to retire
Expected main source of income at retirement
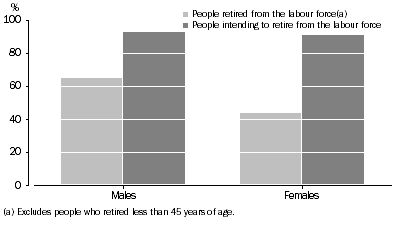
People in the labour force aged 45 years and over who intended to retire showed different responses from the retired group regarding their main (expected) income source at retirement. Many retired people reported a government pension or allowance (1.3 million people or 44%), whereas only 854,300 people (or 25%) reported a government pension or allowance as their main expected source of income at retirement. This group had the highest intended age of retirement (64 years), which reflects the age of eligibility to receive pensions such as the Australian Age pension. Many people intending to retire reported superannuation or annuity (1.4 million people or 41%) as their expected main source of income at retirement. The prevalence of superannuation or annuity as the expected main source of income at retirement is consistent with the increase in the number of people participating in superannuation schemes. Over 90% (or 3.1 million) of people intending to retire indicated that they had contributed to a superannuation scheme at some time, compared with 55% of people who had retired from the labour force when they were aged 45 years or over. Such trends reflect changes to superannuation legislation over the last two decades, in particular the Superannuation Guarantee Charge Act, introduced in 1992, which requires employers to make superannuation contributions for all employees earning $450 or more a month.
People who had contributed to a superannuation scheme
__________________________________________
1Based on preliminary 2005 estimates. Source: Population by age and sex, Australian States and Territories, June 2005 (cat. no. 3201.0).
 Print Page
 Print All