SEPTEMBER KEY FIGURES
 |  | Sep Qtr 11 | Jun Qtr 11 to Sep Qtr 11 | Sep Qtr 10 to Sep Qtr 11 |
 |  | $m | % change | % change |
|
| Trend estimates(a) |  |  |  |
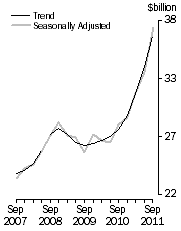
 | Total new capital expenditure | 36 513 | 8.2 | 30.4 |
 | Buildings and structures | 20 754 | 11.3 | 41.3 |
 | Equipment, plant and machinery | 15 626 | 3.4 | 17.5 |
| Seasonally adjusted(a) |  |  |  |
 | Total new capital expenditure | 37 289 | 12.3 | 31.1 |
 | Buildings and structures | 21 480 | 17.1 | 39.5 |
 | Equipment, plant and machinery | 15 809 | 6.3 | 21.1 |
|
| (a) In volume terms |
New Capital Expenditure, in Volume Terms

|  |
SEPTEMBER KEY POINTS
ACTUAL EXPENDITURE (VOLUME TERMS)
- The trend volume estimate for total new capital expenditure rose 8.2% in the September quarter 2011 while the seasonally adjusted estimate rose 12.3%.
- The trend volume estimate for buildings and structures rose 11.3% in the September quarter 2011 while the seasonally adjusted estimate rose 17.1%.
- The trend volume estimate for equipment, plant and machinery rose 3.4% in the September quarter 2011 while the seasonally adjusted estimate rose 6.3%.
EXPECTED EXPENDITURE (CURRENT PRICE TERMS)
- This issue includes the fourth estimate (Estimate 4) for 2011-12.
- Estimate 4 for 2011-12 is $158,032m. This is 26.9% higher than Estimate 4 for 2010-11. Estimate 4 is 5.1% higher than Estimate 3 for 2011-12.
- See pages 7 to 10 for further commentary on expectations data.
NOTES
FORTHCOMING ISSUES
| ISSUE (QUARTER) | Release Date |
| December 2011 | 1 March 2012 |
| March 2012 | 31 May 2012 |
| June 2012 | 30 August 2012 |
| September 2012 | 29 November 2012 |
CHANGES IN THIS ISSUE
- Each September quarter the reference and base year for chain volume estimates for the Survey of Private New Capital Expenditure are updated. A new base year, 2009-10, has been introduced into the chain volume estimates which has resulted in minor revisions to growth rates in subsequent periods. In addition, the chain volume estimates have been re-referenced to 2009-10. Additivity is preserved in the quarters of the reference year and subsequent quarters. Re-referencing affects the level of, but not the movements in, chain volume estimates.
- As happens each year, a seasonal re-analysis has been undertaken based on estimates up to and including the June quarter 2011. No significant changes have occurred this re-analysis, resulting in only minor revisions to the seasonally adjusted estimates.
INQUIRIES
For further information about these and related statistics, contact the National Information and Referral Service on 1300 135 070 or Liz Bolzan on Sydney (02) 9268 4508.
 Quality Declaration
  Print Page
 Print All